A Myfxbook page tells you how a trading account has really performed, but no single number on it tells the whole story. Read Gain next to Absolute Gain, drawdown next to return, and profit factor next to the number of trades. A live record of an expert advisor (EA) earns your trust only when these numbers agree with each other.
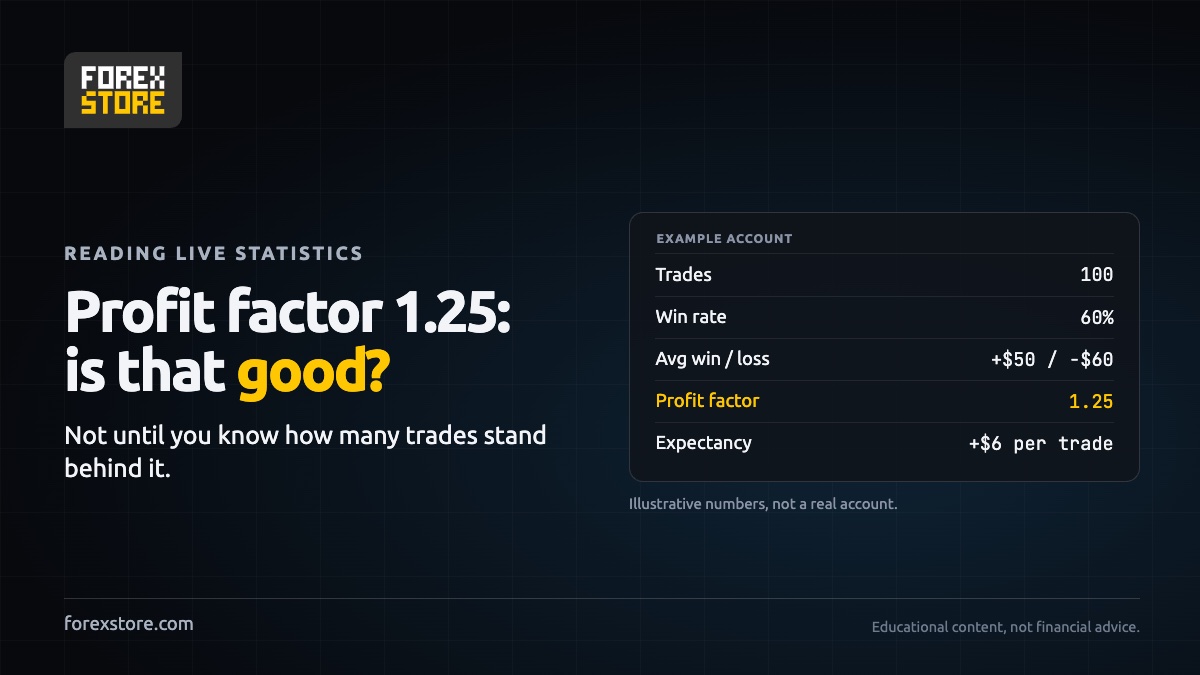
Below we go through the statistics in the order worth checking them: what verification proves, Gain and Absolute Gain, drawdown, profit factor, expectancy, the number of trades, the age of the account and the shape of the curve. Our main example is an illustrative account, not a real one: 60% winning trades, an average win of +$50 and an average loss of −$60.
What Myfxbook Shows, and What It Doesn't
Myfxbook connects to a MetaTrader account and builds statistics from its trading history. That makes it much harder to fake than a screenshot or a backtest, but two verification marks are worth reading before anything else:
| Label | What it confirms | What it doesn't |
|---|---|---|
| Track record | The history on Myfxbook matches the history from the broker | That the strategy will keep working |
| Trading privileges | Whoever added the account holds its master password | That the advertised EA placed the trades |
Also check whether the account is real or demo, and which broker it trades with. A demo account doesn't face the same execution, and a real account at another broker can get different fills (more in Slippage and Order Execution in Forex).
Gain vs Absolute Gain
These two percentages answer different questions:
- Gain shows how the strategy performed. Myfxbook uses a time-weighted return (TWR): each trade's profit is measured against the balance when that trade was opened, so deposits and withdrawals don't distort the figure.
- Absolute Gain shows what happened to the money put in. It divides total profit by total deposits and ignores when deposits and withdrawals happened.
With no deposits or withdrawals after the start, the two figures should stay close. When they drift apart, cash movements are the first thing to check. Two simple examples show why (our own arithmetic, Myfxbook's figures can differ slightly):
| What happened | Gain | Absolute Gain |
|---|---|---|
| $1,000 grows 20%, then $9,000 is added, then the account falls 10%. Balance: $9,180 | +8% | −8.2% |
| $10,000 grows to $15,000, then $14,000 is withdrawn, then the account falls 50%. Balance: $500 | −25% | +45% |
In the first case the owner lost $820 of $10,000, yet Gain stays positive, because the good month happened on a small balance and the bad one on a large balance. In the second it is the reverse: the owner ended $4,500 ahead, yet Gain is negative, because the good month happened on a large balance and the bad one on a small balance. Neither number is wrong. Each just needs the other beside it, along with the list of deposits and withdrawals.
A monthly return on a robot's page needs the same care. Myfxbook's Monthly figure is the compound monthly rate that leads to the total gain. It smooths the past and isn't a schedule, so don't multiply it by twelve and expect that result.
Drawdown: How Far the Account Fell
Drawdown measures the drop from a peak to the next low. It is the number that tells you what holding this strategy has felt like. According to Myfxbook Help, the figure on the account page is the highest of three calculations:
- End-of-day: includes the floating loss on trades still open when each day ends.
- Intraday: looks at account equity at each update.
- Growth: compares each day's gain with the highest gain before it, using the TWR formula.
Only the end-of-day and growth values feed the drawdown chart, so the headline figure can be higher than anything you see on that chart. And since the intraday check depends on updates, a dip between two updates may not be counted.
The other distinction to know is balance against equity, as the MetaTrader 5 Help defines them:
| Drawdown | Counts | What it can hide |
|---|---|---|
| Balance | Closed trades only | Losing trades left open |
| Equity | Closed trades plus floating profit or loss | Much less: losses still open are included |
A strategy that holds losing trades open, as grid and averaging systems do, can show a smooth balance while equity falls much deeper. So equity drawdown is the one to compare.
Keep three things in mind when you read it:
- It is the worst so far, not the worst possible. A longer record often means a deeper maximum, and the next drawdown can exceed the last.
- Recovery takes more than the fall. After −25% an account needs +33% to get back, and after −50% it needs +100%.
- Translate it into money. There is no universally safe percentage. Ask whether you would keep the robot running through that loss on your own deposit, with your own position size and risk limits.
To compare accounts, look at the return against the drawdown. MetaTrader calls this the recovery factor: net profit divided by maximum drawdown.
Profit Factor and Expectancy
Profit factor is gross profit divided by gross loss. A value of 1 means the two are equal. Expectancy (MetaTrader calls it expected payoff) is the average result of one trade: net profit divided by the number of trades. Here is our example over 100 trades:
| Statistic | Calculation | Result |
|---|---|---|
| Gross profit | 60 × $50 | $3,000 |
| Gross loss | 40 × $60 | $2,400 |
| Profit factor | $3,000 ÷ $2,400 | 1.25 |
| Expectancy | 0.60 × $50 − 0.40 × $60 | +$6 per trade |
The margin is thinner than it looks. With the same average win and loss, a 55% win rate leaves an expectancy of just +$0.50 per trade.
Both numbers also ignore the order of trades. Take those same 100 trades on a $10,000 account. Repeat them as three wins, then two losses, and the worst dip is $120, about 1.2%. Put the 40 losses first, and the account falls $2,400, or 24%, before it recovers. Profit factor is 1.25 and expectancy is +$6 in both cases.
And they are normally built from closed trades. An account holding a large floating loss can still show a high profit factor, because that loss hasn't been booked yet. This is why profit factor must always be read beside equity drawdown.
So is 1.25 good? There is no single threshold. It depends on what it costs in drawdown and, above all, on how many trades stand behind it.
How Many Trades Is Enough?
An average from a small sample is an estimate, and it can be far off. Here is the 95% range for that +$6 per trade at different sample sizes, assuming independent trades of a fixed size (our own calculation):
| Trades | 95% range per trade | Does it include zero? |
|---|---|---|
| 100 | −$4.6 to +$16.6 | Yes |
| 500 | +$1.3 to +$10.7 | No |
| 1,000 | +$2.7 to +$9.3 | No |
At 100 trades, this record can't yet be told apart from a strategy with no edge at all. For readers who want the formula: the range is ±1.96 × SD ÷ √n, where SD is the standard deviation of one trade ($53.9 here) and n is the number of trades.
Real trade lists are often less reliable than that. If an EA opens ten orders in one basket and closes them together, those are ten lines in the history but really one decision. For grid and averaging systems, count baskets rather than trades.
How Old Is the Account?
Trades tell you how much data there is. Age tells you how many different markets it covers. A thousand trades from one quiet quarter say less than a thousand spread over several years that include trends, ranges and sudden news.
- Check real activity. An old account with long gaps has traded for less time than its age suggests.
- Read the last months separately. A strong start can hide a weak recent period, so look at the monthly table.
- Allow for survivors. A developer can run several accounts and promote the one that did best. Length of record helps, because luck is harder to sustain over years.
The Shape of the Curve
The chart shows what the summary numbers smooth over. Compare the growth line with the equity growth line, and ask a few simple questions:
| What you see | What to check |
|---|---|
| A very straight growth line | Whether equity drops far below it: losses may be sitting in open trades |
| Most of the gain in one jump | Whether a few trades made the whole result |
| Long flat stretches | Whether the EA was switched off or simply found no trades |
| Slope weakening over time | Whether the edge is fading or the account is in a normal slow period |
A smooth curve is pleasant to look at, but it isn't proof of low risk on its own. A jagged one with shallow dips can be the healthier record.
A Five-Minute Check
- Verified labels: is it a real account, and is the track record verified?
- Gain and Absolute Gain: if they differ, can the deposits and withdrawals explain it?
- Drawdown: what is the equity figure, and could you hold through it in money?
- Profit factor and expectancy: how much is left per trade after costs?
- Sample: how many trades, or baskets, stand behind those numbers?
- Age: does the record include different markets and recent months?
- Curve: do growth and equity growth move together?
You can practise on our top forex robots by rating or browse every expert advisor in the catalog. Each robot page shows Gain, Monthly, Drawdown and days in live trading, plus a status next to each account: active, stopped or blown. The same questions apply to any tracker, not only Myfxbook.
FAQ
What is the difference between Gain and Absolute Gain on Myfxbook?
Gain is a time-weighted return that measures the strategy without the effect of deposits and withdrawals. Absolute Gain divides total profit by total deposits and shows what happened to the money put in. If the two differ a lot, check the cash movements on the account.
Is a profit factor of 1.25 good?
It means gross profit is 25% larger than gross loss, but there is no universal threshold. Read it with the number of trades and the drawdown. In our example of 60% wins, +$50 and −$60, an expectancy of +$6 per trade is not statistically distinguishable from zero after 100 trades.
How does Myfxbook calculate drawdown?
Myfxbook Help describes three calculations: end-of-day, intraday and growth. The figure on the account page is the highest of the three. Only the end-of-day and growth values feed the drawdown chart, so the headline number can be higher than the chart.
How many trades do you need to trust a live record?
There is no magic number, because it depends on how large the average result is compared with the spread of results. In our example, zero is inside the 95% range at 100 trades and outside it at 500. Grid and averaging systems need more care: count baskets rather than single orders.
Does a verified Myfxbook account mean the results will continue?
No. Verification confirms that the history matches the broker's data and that whoever added the account holds its master password. It says nothing about future results, and past performance doesn't guarantee them.
The Bottom Line
- Start with verification, then read every number next to its partner, not alone.
- Gain measures the strategy, Absolute Gain measures the money, and cash movements explain the gap.
- Equity drawdown shows the real depth, and it is the worst so far rather than the worst possible.
- Profit factor 1.25 and +$6 per trade mean little until enough trades stand behind them.
- Age and the shape of the curve show whether the record covers different markets and how it got there.
New to all this? Start with our step-by-step guide to start trading, then learn how to size trades in Money Management in Forex.
This article is educational and is not investment advice. The example account is illustrative. Past results do not guarantee future results, and trading leveraged products involves risk of loss.