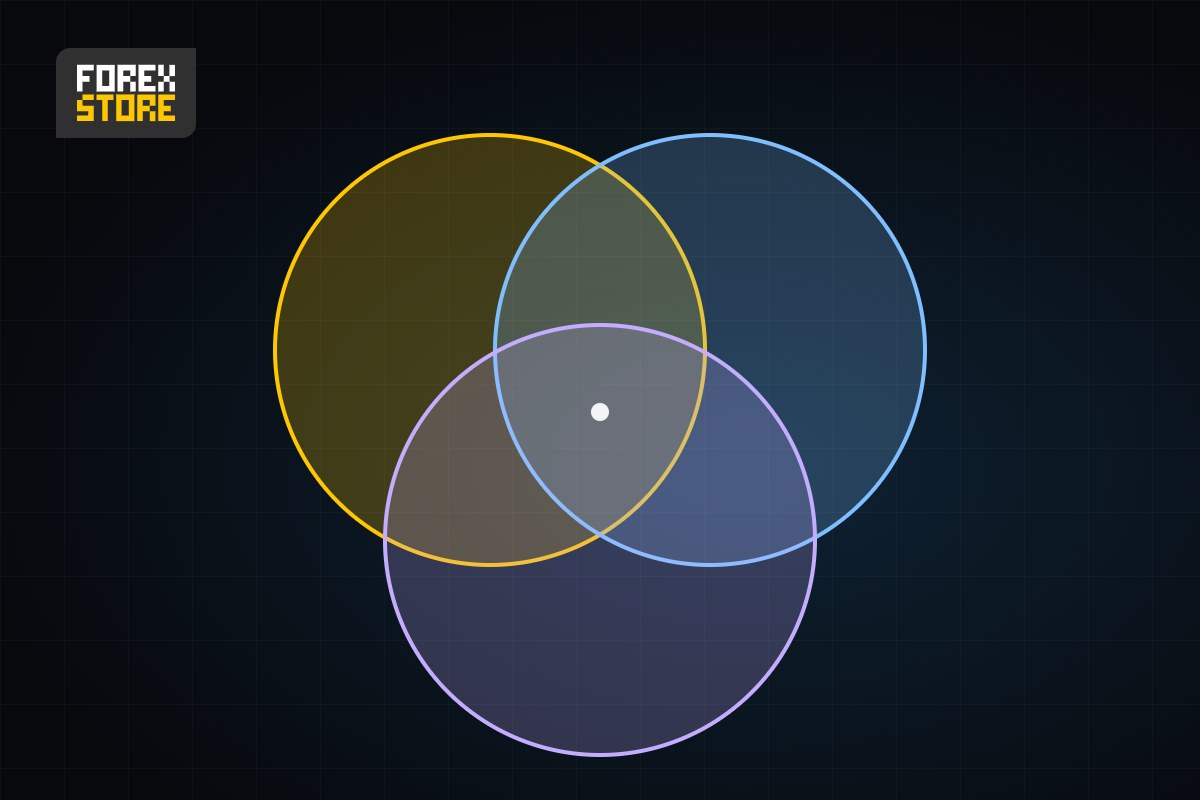
A portfolio of forex EAs lowers risk only when the robots' results don't move together. The number of robots says little by itself: three equal EAs sharing one risk budget swing about 58% as much as a single EA if their correlation is 0, but about 93% as much if it is 0.8 (our calculation). So correlation has to be measured on the EAs' own results, and the plan has to survive their worst periods lining up.
Below we cover what correlation means for EAs, how much risk diversification really removes, where hidden overlap comes from, how to measure it, and how to set a drawdown budget for the whole portfolio. If you are new to this, the first sections and the checklist are enough to start. The later parts are for traders who already run several systems. A portfolio can't make a losing system profitable, and it doesn't remove the risk of loss.
What Correlation Means for EAs
Correlation is a number from −1 to +1 that shows how closely two series move together:
| Correlation | What it means for two EAs |
|---|---|
| +1 | Good and bad days always come together |
| 0 | No linear link between their results |
| −1 | When one has a good day, the other has a bad one |
What counts is the correlation of the EAs' daily results, not of the pairs they trade. Two EAs on EUR/USD can differ a lot if one follows trends and the other trades ranges. Two EAs on different pairs can behave alike if both sell the dollar in the same hours.
How Much Risk Does Diversification Remove?
For equal EAs with the same volatility, portfolio volatility relative to one EA is:
√((1 + (n − 1) × correlation) ÷ n), where n is the number of EAs.
It matters how you size them. If three EAs share the risk budget of one, volatility falls. If each runs at the full size you would use for one EA, volatility rises, and diversification only softens the rise:
| Correlation | 3 EAs share one budget | 3 EAs, each at full size |
|---|---|---|
| 0.0 | 58% | 173% |
| 0.5 | 82% | 245% |
| 0.8 | 93% | 279% |
| 1.0 | 100% | 300% |
Our calculation. Volatility relative to one EA; equal weights and equal volatility assumed.
Each new EA also helps less than the one before. At a correlation of 0.5, sharing one budget gives:
| Number of EAs | Volatility relative to one EA |
|---|---|
| 2 | 87% |
| 3 | 82% |
| 5 | 77% |
| 10 | 74% |
| Limit | 71% (√0.5) |
Our calculation with the same assumptions.
So the shared part of the risk stays, however many robots you add. Lower correlation does more than a longer list of EAs. Keep in mind that volatility describes normal swings. It says little about the worst week, which is why a separate drawdown budget comes later.
Where Hidden Overlap Comes From
- A shared currency. Buying EUR/USD and GBP/USD means selling the dollar twice. These pairs often move together, so two 1% trades behave more like one 2% trade, as we show in Money Management in Forex.
- The same logic. Two trend followers tend to lose in the same sideways market. Two systems that add to losing trades tend to be in trouble during the same strong move.
- The same hours. EAs that trade the same session face the same news and the same wide spreads at rollover.
- The same account and infrastructure. One margin balance, one broker and one VPS are shared by every EA on them. A rule change hits them all at once: when FXOpen discontinued STP accounts, everyone trading on those accounts had to move.
Opposite trades are not a free hedge. A BUY on EUR/USD and a SELL on GBP/USD cancel much of the dollar exposure, but what remains behaves much like a position on EUR/GBP. That is a trade with its own risk, and you pay two spreads to hold it.
How to Measure Correlation Between Two EAs
- Collect each EA's result per day, as a percentage, over the same dates. Live accounts are better than backtests, because a tester doesn't show how two systems behaved in real conditions.
- Put the two columns in a spreadsheet and use CORREL in Excel or Google Sheets.
- Repeat with weekly results. An EA that trades rarely has many zero days, and they pull the daily figure towards 0 even if both EAs lose in the same weeks.
- Repeat for several periods, and look separately at the weeks when either EA was in a drawdown.
- Compare the drawdown dates of the two equity curves. If the deep ones overlap, treat the pair as correlated whatever the average says.
A short sample gives a rough answer. If the true correlation is near 0, the measured figure can easily land this far from it:
| Trading days of data | Approximate 95% range around 0 |
|---|---|
| 60 (about 3 months) | ±0.25 |
| 125 (about 6 months) | ±0.18 |
| 250 (about 1 year) | ±0.12 |
Our calculation: ±1.96 ÷ √days, assuming independent daily results. Real EA results are rarely that clean, so treat the range as a minimum.
Correlation Is Not Constant
A figure from calm months says little about a stressed market. Research on international equity markets found that correlations rise in bear markets (Longin and Solnik, Journal of Finance, 2001). That study is about stocks, not currencies or EAs, so don't read it as a rule for forex. But it is a good reason not to build a plan on one low number. In forex, a large move in the dollar can push several pairs the same way at once. Assume diversification may help less exactly when you need it most.
Build a Drawdown Budget
Instead of relying on correlation, plan as if the worst periods line up. Example with invented figures, at the lot sizes you intend to trade:
| Past max drawdown | After scaling by 0.8 | |
|---|---|---|
| EA 1 | $1,000 | $800 |
| EA 2 | $800 | $640 |
| EA 3 | $700 | $560 |
| Plan for | $2,500 | $2,000 |
On a $10,000 account, $2,500 is 25%. If your limit is 20%, or $2,000, scale all three by $2,000 ÷ $2,500 = 0.8. Any overlap you avoid is a bonus, not part of the plan.
- A past drawdown isn't a ceiling. The next one can be deeper, so a limit you could barely tolerate is too high.
- Small lots round coarsely. Brokers usually allow steps of 0.01 lot, so 0.03 lot × 0.8 = 0.024 becomes 0.02, a cut of a third rather than a fifth. Round down, and recheck the total.
- Check open risk too. Add up the risk of all open trades across the EAs. Many traders cap it at a few percent, and the lot size calculator does the arithmetic per trade.
How risk percent, lot size and drawdown work for one robot is covered in Forex EA Settings That Matter.
One Account or Several?
One account is simple, and its margin is shared. That is also the risk: a stop-out looks at the whole account, so a deep drawdown in one EA can close trades of the others. MetaTrader tells an EA's trades apart by a number called a magic number, so if you run two EAs on one account, check in each manual how it identifies its own trades.
Separate accounts keep each EA's margin and statistics apart, and they make correlation easier to measure. They don't change the total you can lose, and you need enough money on each one to carry the lots you plan to trade. If they are all at one broker, the broker risk stays shared.
A Checklist Before You Add an EA
- Write down the total drawdown you can accept in money, before looking at any robot.
- List the pairs, direction bias, strategy type and trading hours of every EA, and mark what they share.
- Measure correlation on daily and weekly results, and compare the drawdown dates.
- Add up the past max drawdowns at your lot sizes, and scale them to fit your limit.
- Check that the margin is enough if all the EAs hold trades at once.
- Decide in advance what would make you pause or remove an EA.
To compare candidates, our catalog of forex robots lists each robot's pairs, timeframe and live accounts on its page.
FAQ
How many EAs should I run at once?
There is no right number. It depends on how much their results overlap and how much drawdown you can accept. Our calculation at a correlation of 0.5 shows why more isn't always better: sharing one budget gives 82% of one EA's volatility with three EAs and 74% with ten.
What correlation between EAs is low enough?
There is no official threshold, and a single figure can mislead. Even at 0.5, three equal EAs keep about 82% of the volatility of one EA. Measure several periods, look at weekly results, and check whether the deep drawdowns fall on the same dates.
Can two EAs on the same pair be a real portfolio?
They can if their results differ, for example a trend system and a range system. But their lots add up when they trade in the same direction, and they share every shock on that pair. Measure their correlation instead of assuming it from the strategy names.
Should every EA have its own account?
It isn't required. Separate accounts keep margin and statistics apart, so one EA's drawdown can't trigger a stop-out for the others. One account is simpler and shares margin, but a stop-out looks at the whole account. Neither option changes the total you can lose.
Does a portfolio of EAs remove drawdowns?
No. It can make swings smaller when results don't move together, but several EAs can lose at the same time, and correlation can rise in a stressed market. Plan as if the worst periods line up, and accept that a future drawdown can be deeper than the past ones.
The Bottom Line
- Low correlation spreads risk. The number of robots alone doesn't.
- Measure correlation on the EAs' own results, daily and weekly, not on the pairs.
- Three EAs at full size add risk even at zero correlation: about 173% of one EA's volatility.
- Look for what they share: currency, logic, hours, account and broker.
- Plan a total drawdown budget as if the worst periods line up, and scale the lots to fit.
If you are just getting started, read our step-by-step guide to start trading first.
This article is educational and is not investment advice. Past results do not predict future results. Trading leveraged products involves risk of loss.