Market volatility is one of the key concepts of Forex trading. It reflects the level of risk and profitability of operations, so it should never be overlooked. In this article, we will discuss volatility indicators that allow you to measure volatility levels in quantitative terms to make the right decisions and build an effective trading strategy.
What Is Market Volatility?
Volatility is a concept that reflects the variability of the price of a certain asset. Simply put, it is the range of fluctuations in value over a certain period. Usually, its high level is considered a negative factor, because it carries significant risks. But along with them come opportunities — sharp changes in market conditions allow you to quickly close deals with large profits.
A market is considered volatile if its price changes greatly over a short period — usually days, hours, or even minutes. Often, it is difficult to predict it, as we are talking about unexpected jumps, which are not always subject to logic. Low volatility means that the market follows the general trend. The price changes smoothly within small limits — it is relatively easy to predict its dynamics.
Volatility calculated on the basis of statistical data is called historical volatility. It reflects price fluctuations in the past. Although this indicator is important to take into account in the trading strategy, it does not always correctly reflect the possible dynamics in the future. Therefore, traders also talk about expected volatility, which includes all possible factors affecting the market. It is this volatility that is used in the pricing of futures, options, and other derivative financial instruments.
The Importance of Volatility Indicators
Forex volatility indicators are integral mathematical indicators that display the level of price fluctuations. By displaying the degree of risk and profitability, they allow you to consider different currency pairs in terms of your preferred trading style.
A high-volatility market is ideal for short-term trades, including scalping. Serious price fluctuations make it possible to close orders quickly, making a relatively small but stable profit. Low volatility will be the best choice for long-term trading. The absence of sharp outbursts and breakouts will protect you from unexpected losses.
High values of Forex volatility indicators also serve as a guide for traders who prefer to go against the trend. They mean that the market is prone to unexpected reversals and cannot go in one direction for long.
An FX volatility index is also used for the following purposes:
- To assess the strength of a trend;
- To determine the point of market reversal;
- To set stop-losses and take-profits on marginal trades.
Types of Volatility Indicators
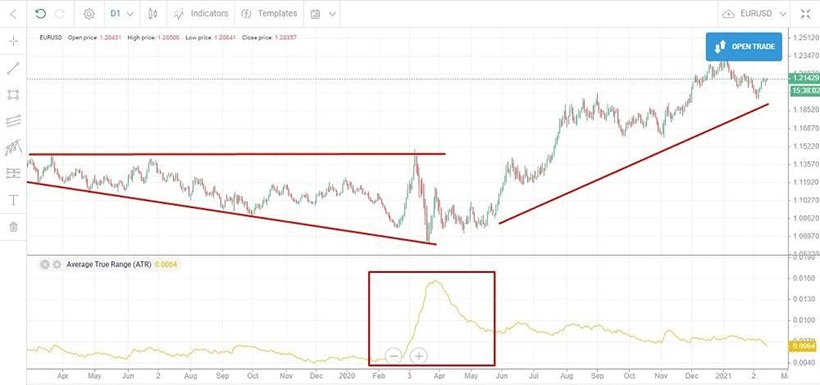
Average True Range (ATR)
It is one of the best volatility indicators. Suitable for most markets, including Forex. It is easy enough to calculate and is represented among the tools of many trading platforms. Average True Range is used to estimate the level of price fluctuations in the foreseeable past. It allows you to clear the data from market noise and set clear targets. It is taken into account when setting stop-losses and take-profits — this indicator helps to avoid unexpected closing of orders in case of random fluctuations.
To tell about the methodology of calculating this Forex volatility index, it is necessary to first define the concept of the true range. It uses three indicators:
- The difference between the minimum and maximum price of the last period;
- The difference between the minimum price of the last period and the closing price of the period before it;
- The difference between the maximum price of the last period and the closing price of the period before it.
In all cases, the absolute value is calculated, i.e. the number without taking into account the sign before it. The true range will be equal to the maximum of the three indicators. In calculating the average true range, the last 14 periods are used. Their values are summarized and then divided by the number, i.e. 14.
Here is a simplified hypothetical example. Today's maximum in the euro/dollar pair is 1.14, the minimum is 1.01. Yesterday's closing price is 1.11. Therefore, we choose the maximum of the three values:
- 1,14–1,01=0,13;
- 1,01–1,11=|-0,10|=0,10;
- 1,14–1,11=0,03.
The highest value is observed in the first case — the difference between the minimum and maximum price of the last period is equal to 0.13. It is this difference that will be considered the true range. Continuing the example, let's assume that for the last 13 days, the true ranges took the value of 0.1 five times, 0.05 five times, and 0.15 three more times. The average true range would be:
(0,13+0,1+0,1+0,1+0,1+0,1+0,05+0,05+0,05+0,05+0,05+0,15+0,15+0,15)/14=0,095
This volatility indicator Forex is found on all popular trading platforms. It is also used to customize the best Forex robots. The indicator displays the expected fluctuations within your trading period, be it a minute, hour, day, week, or month. It can also be used as a reference when planning target profits and evaluating long-term trends.
But it is worth remembering the limitations of the average true range. It indicates only the absolute value of fluctuations, not the trend direction. Besides, traders can interpret its value in their strategies in different ways — there is no consensus on how to use this indicator.
Bollinger Bands
It is a clear Forex volatility indicator, which is also among the tools of many professional traders. It indicates the normal price range of a currency pair, allowing you to identify trend reversal points and predict further market dynamics.
To draw the lines, three Forex volatility indices are calculated:
- Moving average for 20 periods — base band;
- Moving average plus two standard deviations — the upper band;
- Moving average minus two standard deviations — the bottom band.
Calculation of the simple moving average in this case will be easy — you just need to summarize the closing prices for the last 20 periods and divide them by 20. However, the formula for the standard deviation (standard deviation) may cause some difficulties for novice traders:
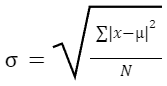
where μ is the arithmetic mean over the specified time interval;
x — specific price value in one of the periods;
N — number of periods in the time interval.
Let's consider a simplified hypothetical example. The exchange rate of the euro to the Swedish krona for the last five days was:
- 10;
- 9,8;
- 9,6;
- 9,2;
- 9,7.
The five-day moving average is (10+9.8+9.6+9.2+9.7)/5=9.66. Now, let us calculate the standard deviation:
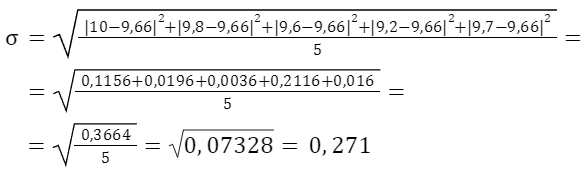
So, we can determine the position of Bollinger bands for the current period:
- Upper band — 9,66+2*0,271=10,20;
- Base band — 9,66;
- Lower band — 9,66-2*0,271=9,12.
In reality, the calculation of volatility indicators will not be so simple. First, instead of five values, you will have to deal with twenty. Secondly, the moving average and standard deviation change every period — usually, we are talking about days, but in short-term trading, they can change by hours and minutes. Fortunately, trading platforms make all the necessary calculations automatically — you only have to choose the necessary period.
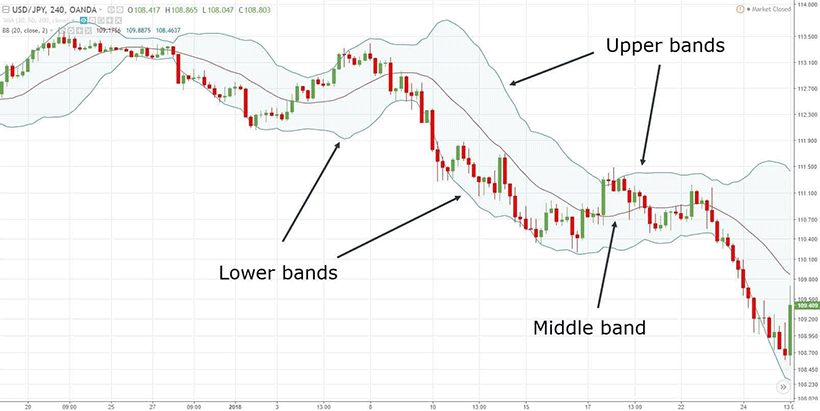
The range inside the Bollinger Bands is considered a normal fluctuation of the price level. The wider this space is, the higher the market volatility is. But going beyond its limits signals anomalies. Usually, traders believe that when the upper boundary is touched, the trend changes to a downward trend, and the lower boundary changes to an upward trend. This allows you to determine the reversal points and choose the ideal moment to enter the transaction. However, you should remember that the interpretation of any indicators depends largely on the context.
Volatility Channels (Donchian Channels)
It is a simplified version of Bollinger lines, which allows you to evaluate price fluctuations and determine the general trend. It uses three Forex volatility indices:
- Upper band — the maximum price of the currency pair for the selected period;
- Lower band — the minimum price of the currency pair for the selected period;
- Base band — the moving average for the selected period or the sum of the maximum and minimum divided by 2.
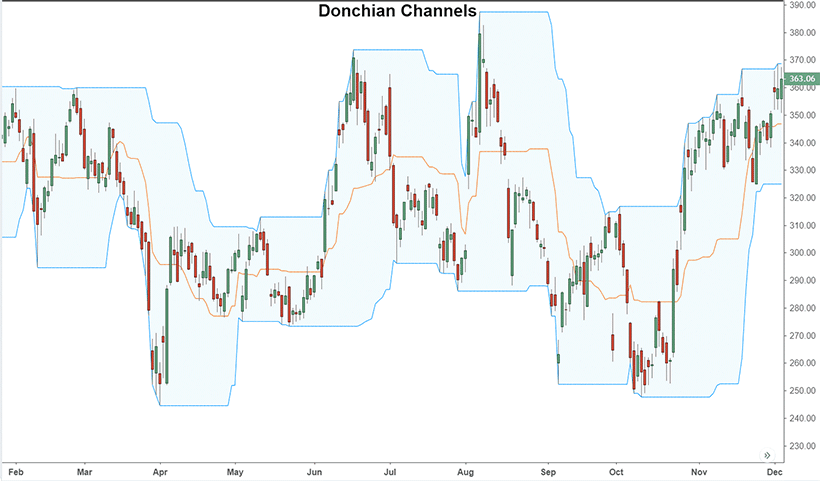
The advantage of this Forex volatility indicator is that it does not require complex calculations. In fact, you only need to draw a couple of lines on the chart, dividing the space between them in half. But there is a disadvantage — the interpretation will be quite complicated. When the actual price approaches the upper or lower boundary, it can mean both the fixation of the established trend and its break. As usual, everything depends on the context — don't forget to use other technical indicators in your trading strategy.
Parabolic SAR
SAR in this case means stop and reversal price, which clearly shows the essence of the methodology. Such a Forex volatility index allows you to determine not only the direction of the trend but also the rate of price growth or decline. It is used both for assessing the intensity of fluctuations and for forecasting.
The basis of the SAR theory is the assumption that the trend unfolds when the price reaches a certain extreme value. The market enters a phase of overheating, which leads to a significant increase in the number of orders opened in the opposite direction. These FX volatility indices are calculated using the following formulas:
- For an uptrend — SAR=SARn-1+α(H-SARn-1);
- For a downtrend — SAR=SARn-1-α(SARn-1-L),
where SARn-1 is the indicative reversal price of the previous period, H is the new maximum price since the beginning of observations or position opening, L is the new minimum price, and α is the acceleration factor. The last value is of special interest. The author of the methodology suggests fixing it at the following levels:
- 0.02 — at the moment of reversal;
- α+0.02 — when a new maximum or minimum is reached;
- 0.2 — at the peak of acceleration.
In fact, the coefficient starts at 0.02, increases by 0.02 at each extreme point, and increases until it stops at the reversal point. However, it cannot increase to more than 0.2.
Let's take a simplified hypothetical example. We have the following minimum daily values of the dollar-Japanese yen exchange rate:
- 150;
- 148;
- 146;
- 143;
- 142;
- 141;
- 140.
Volatility indicator SAR of the first period will be equal to 150. Since on each subsequent day, the rate shows a new minimum value, with each calculation step, the acceleration factor will increase by 0.02. Let's perform the calculations:
- 150;
- 150-0,02(150-148)=149,96;
- 149,96–0,04(149,96–146)=149,80;
- 149,80–0,06(149,80–143)=149,39;
- 149,39–0,08(149,39–142)=148,80;
- 148,80–0,1(148,80–141)=148,02;
- 148,02–0,12(148,02–140)=147,06.
If the rate had risen to the SAR level in the specified time interval, it could mean a trend reversal. With a high degree of probability, the price fall could be replaced by growth. By comparing the actual rate of a currency pair with the best volatility indicator, you can choose the optimal moment to open an order.
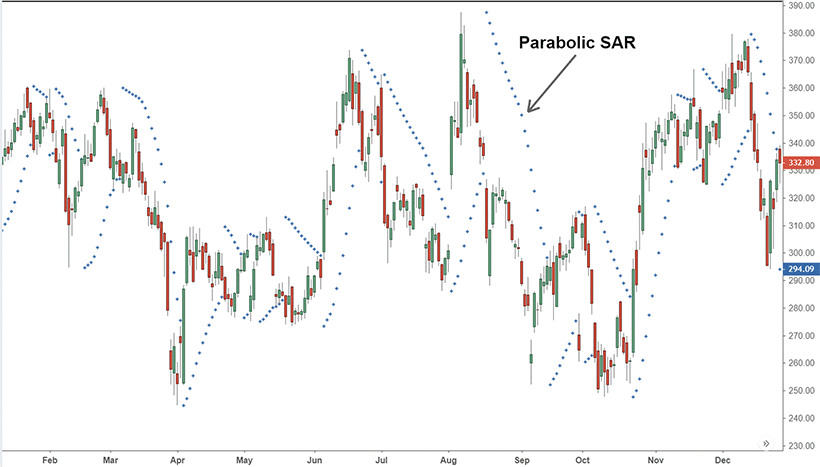
The methodology of SAR calculation is also complex, so it is automated on most trading platforms. Indicative price levels are displayed as dots next to candlesticks. If they are below the chart, it indicates a bullish trend, while if they are above, it indicates a bearish trend. Another interpretation of the indicator is that the greater the difference between the actual price and the SAR (distance from the candle to the point), the more stable the trend and the lower the probability of reversal.
Implementing Volatility Indicators in Trading
Forex volatility indicators will be a handy and extremely useful trader's tool. You can use them in the following ways:
- Put a certain level of risk into your strategy. If it is high enough, it is important to set stop losses correctly to avoid significant losses. You can also use different tactics to minimize risks, for example, open orders in opposite directions.
- Set profit targets and time frames. High volatility indicators suggest that you can make significant profits in a short time, while low ones suggest that you should aim for a long wait.
- Choose certain trading strategies. When volatility is high, it makes sense to go against the trend and open a large number of trades for small amounts, while when it is low, it will not benefit you.
- Determine the ideal moments to open orders. Abnormal price fluctuations outside of normal volatility often lead to a trend reversal and the beginning of a move in the opposite direction.
- Establish acceptable fluctuations, preventing the accidental closing of orders at the wrong moment. Volatility indicators allow you to filter market noise and focus on real signals. This is especially relevant for long-term trading.
Forex Volatility Indicator: Common Mistakes and Pitfalls
The main mistake will be to build a strategy on a single indicator. It is important to realize that there are no universal indicators of technical analysis that can describe the current market situation. It will be represented by a massive matrix of values that set certain scenarios and allow you to choose optimal trading tactics. Therefore, no matter how effective and illustrative a volatility indicator may seem to you, never stop with it. Continue studying technical analysis and other trading techniques.
The pitfalls of Forex volatility indices also include:
- Excessive bias towards historical data. Most indices involve the calculation of average prices for the period in one form or another. Sometimes, this time lag prevents you from seeing the true moment of trend reversal and opening an order in time. Therefore, it is important to not only rely on the past but also forecast the future.
- Dependence on the context. One and the same signal can mean the beginning of different events. For example, reaching the upper boundary of the channel can lead to both strengthening and reversal of the trend. Therefore, it is important to take into account other factors — the number of open orders, investor sentiment, and so on.
- Probability of random outbursts. Some price spikes are caused by events that are not repeated in the foreseeable future. They significantly increase the margin of error, increasing the risks and reducing the profitability of trading strategies.
Conclusion
Volatility indicators are some of the most important technical analysis metrics in Forex trading. They allow you to assess the level of risk and potential benefits of entering a particular market. They are used both for building personal trading strategies and for customizing stock trading robots. Using Forex volatility indices, you can choose the right moments to open and close orders. However, it is worth remembering their disadvantages and limitations — they cannot take into account all the details of the market situation. Therefore, volatility indicators are always used in combination with other methods of technical analysis.