A graphical representation of price fluctuations allows traders to accurately predict future price movements by highlighting certain figures. One of the most common patterns for technical analysis is the Forex wedge pattern. It is clearly visible on the chart and has a high predictive potential. But when you notice it, you should not rush to open long or short positions, as it can indicate both a reversal and a continuation of the trend. You should wait for unambiguous signals, which will be discussed in this article, and only then act decisively.
Types of Wedge Patterns
A Forex wedge pattern is formed for quite a long time on the current bullish or bearish trend. In terms of time, this process takes from 1 to 3 months and can be seen both at the top of the graph and at the bottom. The wedge itself can point up or down depending on the dominance of the bear or bull market. In technical analysis, both of these directions are significant, since it is the direction of the convergence of price minimum and maximum that determines the future effective actions of traders.
Rising Wedge
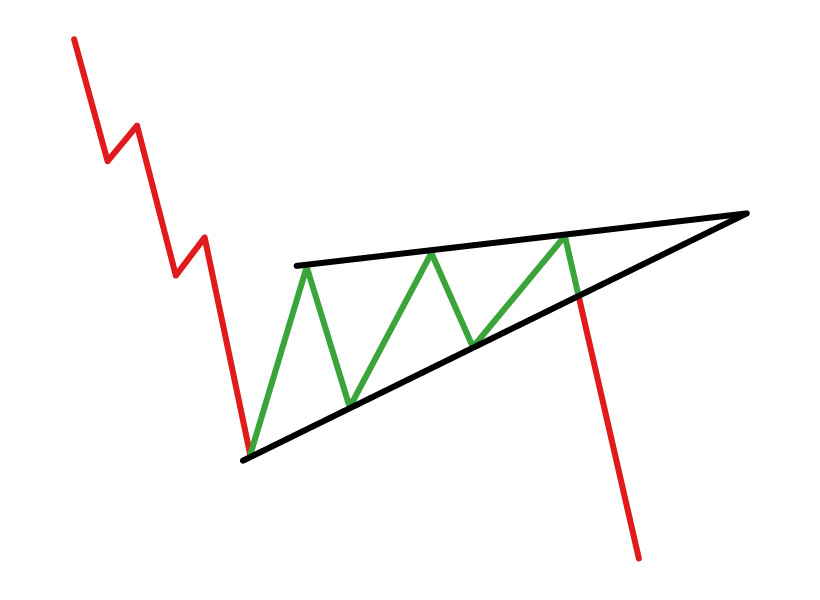
A rising wedge Forex can be formed both during an uptrend and during a downtrend:
- A wedge pointing up means narrowing the price range by slowing price growth. Its progressive formation indicates an imminent trend reversal. So, traders should think about selling their assets.
- If such a wedge forms during a downtrend, then this is a temporary phenomenon that indicates a price correction but does not mean an imminent trend reversal.
Falling Wedge
The same goes for falling wedge Forex:
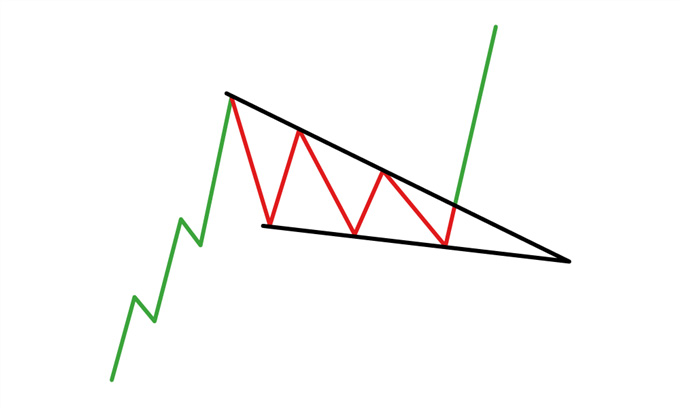
- If the tip of the wedge is pointing down in a downtrend, this indicates price consolidation and its imminent reversal.
- If such a figure is formed during an uptrend, then it does not predict a reversal but rather its continuation. In such a situation, the conditions for buying a currency are still preserved.
Forex Wedge Patternі: Formation and Characteristics
Wedge patterns Forex means that the range in price fluctuations is gradually narrowing. Prices have exhausted their potential for growth in a bull market or fall in a bear market, but at the same time, local highs or lows are renewed for some time.
This pattern of the price chart indicates that the pressure of the opposite trend is increasing, whose time will come when prices break through the lower line of the wedge in a bull market or the upper one in a bear market.
Trading the Wedge Pattern in Forex
If you find a descending or ascending wedge Forex pattern, you should wait for a reliable signal that will indicate a clear trend reversal. And then your actions depend on what type of trading you adhere to — aggressive or conservative:
- According to an aggressive strategy, you need to act immediately to get more profit but remember about higher risks of trading.
- If you follow a conservative strategy, you should wait for the confirmation of the signal to minimize risks, but the profit received in such a case will also be lower.
- If you want to get maximum profit with minimum risk, use the best Forex robots. They do not take rash actions when the signal is not yet obvious, but they do not linger in indecision when the pattern has finally formed.
Entry Points
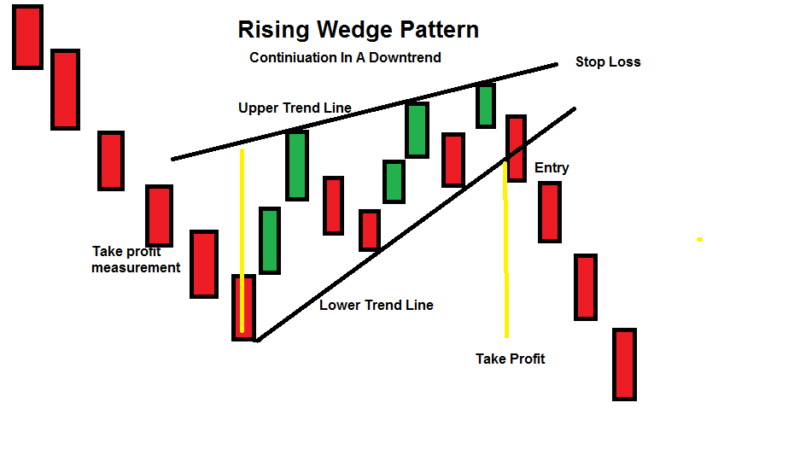
Entry into the market should be made at the breakout of the lower/upper level of a wedge formed on the price movement graph:
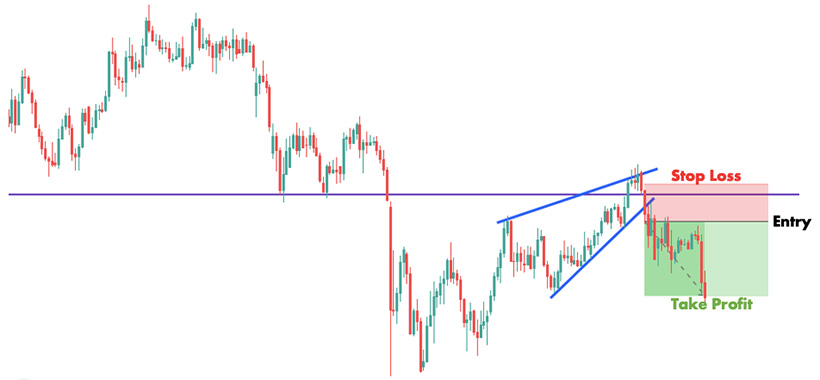
- With a rising wedge pattern, a breakdown of the lower level means that a trader can open short positions.
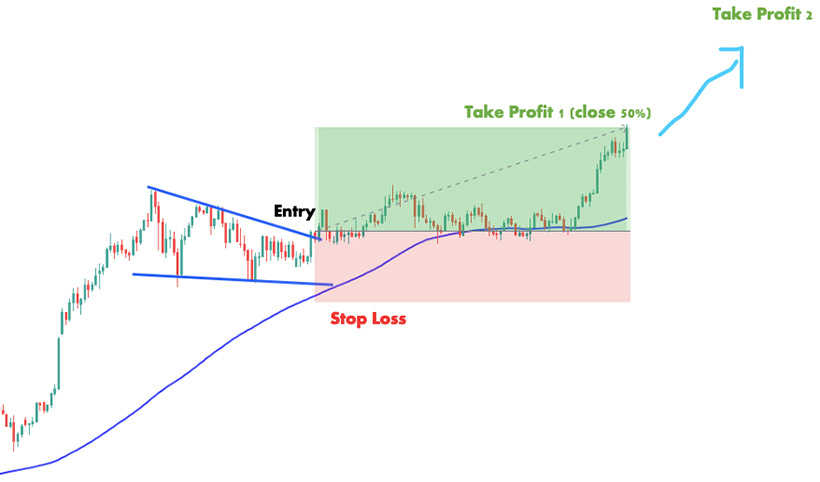
- With a falling wedge pattern, a breakdown of the upper level means that long positions will be profitable.
Stop Loss
Even if you know how to trade wedge chart patterns Forex, you should remember about risk management. The best solution to avoiding great capital loss is a stop loss strategy:
- With an ascending wedge pattern, the stop loss is set just above the last maximum that the currency price reached before.
- With a descending wedge pattern, the stop loss is set just below the last price minimum.
Take Profit
Take profit is set step by step up the stairs in case of an ascending wedge and down the stairs in case of a descending wedge. This is best done in a place where the chart touches a previous support level for a rising wedge or a previous resistance level for a falling wedge.
False Breakouts
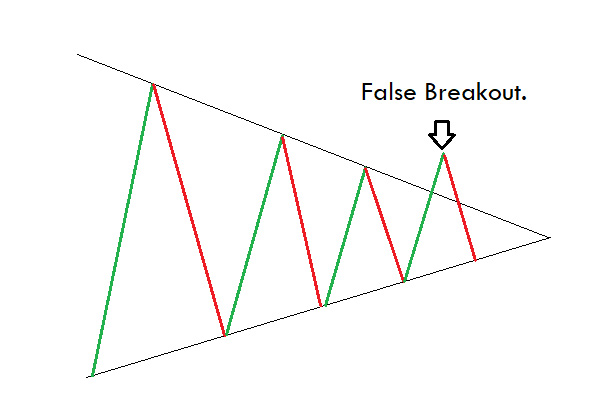
A risk management strategy when trading with a bearish or bullish wedge pattern is critically important because traders may confront false breakouts. In this case, there will be no trend reversal, and the price will soon return to the price range it left. Therefore, in order not to make a mistake in the trading signal, pay attention to the growth of the trading volume and use wise Forex robots.
Limitations and Considerations of the Wedge Pattern in Forex
- Having learned about the peculiarities of trading with the wedge pattern, do not rush to put it into practice. First, you need to figure out whats the difference between a triangle, a pennant, and a wedge in Forex trading.
- In addition, when analyzing a wedge pattern, consider that there should be at least three touches or three waves of price high/low inside the formed pattern.
- Also, note that this pattern has the highest predictive potential on longer timeframes. If you have identified this pattern in a short period, most likely, it will not give you the expected effect.
The Bottom Line
The wedge pattern is so popular among Forex traders because it helps to determine both the market entry points and the place to set take profit and stop loss. And this means that the risks when placing orders will be minimized.
However, remember that the formation of a wedge pattern indicates not only the upcoming trend reversal but also its continuation. It depends on a combination of two characteristics of this pattern:
- Wedge direction — ascending or descending;
- Whether it is formed in an uptrend or a downtrend.
Read graphs mindfully and rely on the work of the best Forex robots to make accurate predictions and maximize profits.


