In addition to the classic candlestick pattern, you may come across other bear candle patterns on your charts. They indicate an upward trend that may come to an end, leading back to a downward trend. So, let's understand what is a bearish candlestick, how to recognize it on the chart, and what it signifies when you see such a pattern before you.
Before we begin, remember a few important nuances: a bearish reversal pattern must form completely; otherwise, it indicates a continuation of the trend. Also, you must confirm the signal you receive using support lines and volume so that you do not misinterpret the pattern and make ineffective trading decisions. So, be attentive. If you are just starting your journey in trading, it might be better to use the best Forex robots that can assist you in the initial stages not to lose your funds and rely not only on your knowledge.
What is a Bearish Pattern?
“Bearish prices” is a decrease in prices relative to the market's upper point by approximately 20%. This is the bearish reversal candlestick pattern meaning, and you should prepare for such a development. However, do not rush; make decisions only after combining several individual candlesticks into one formation and analyzing them together to determine optimal entry or exit points in the market. In other words, you should not open or close positions immediately upon seeing the characteristic pattern but only after confirming that your assumptions are correct.
Importance of Bearish Candlestick Patterns
As implied by the bearish reversal definition, the bearish candlestick chart informs you about a potential change in the price of your assets based on historical data. The candlestick shows you four data points at once:
- Opening
- Closing
- High Max
- Low Max
These points are displayed on the chart as the body of the candlestick (range), wicks (daily high and low), and color (market direction: black or red for price decline, and white or green for price increase).
This information gives you a clear idea of what is happening in the market, where the price is heading, and what to expect in the near future. If the signal obtained is also confirmed by other indicators, you have the opportunity to make effective decisions regarding your positions and assets, and potentially earn more while risking less.
Most Common Bearish Patterns
All bearish patterns in one way or another signal changes in prices, but there are certain differences between them, and therefore, the interpretation of the signal depends on how well you understand the characteristics of each of the patterns that appear on your chart. Let's consider several basic Forex bearish reversal candlestick patterns so that you can easily distinguish between them and understand the peculiarities of each figure. This way, you will be able to identify the best moments for opening or closing trades and practice highly profitable trading.
For the safety of your assets, practice first on a demo account. Once you are confident that you have thoroughly studied all the nuances of interpreting bearish stock patterns, you can proceed to trade with your main account. So, let's embark on a journey to explore the full variety of bearish candlesticks. We will look at the most common options, although besides those proposed below, there are others, which we will also study in the following materials.
Bearish Engulfing Pattern
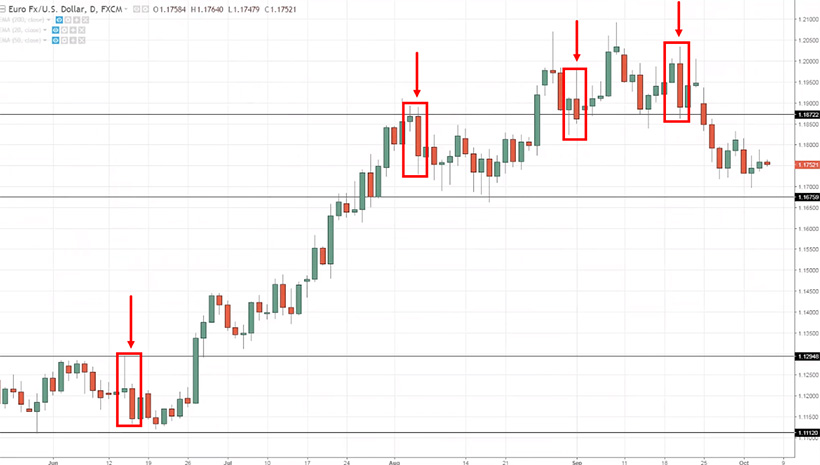
The Bearish Engulfing pattern belongs to the category of bearish reversal candlestick patterns. It signals that the uptrend will be changing, driven by selling pressure at its peak. If you see such a pattern on the chart, it means that sellers are actively trading, and the supply level outweighs demand, causing the price to fall.
How to recognize the presence of a bearish signal?
On the chart, two consecutive candles appear: a bullish one followed by a bearish one. Importantly, the bearish candle completely engulfs, or “eats up,” the body of the previous candle (the one with a green body). It looks like what is shown in the chart above: the red candle has a larger body than the green one, and they are located next to each other. Pay attention: the size of the red (in some charts, black) candle is crucial!
From such an indicator on the chart, one can expect that the intensity of selling will continue to increase until the end of the session. This signal can be easily mistaken for an outside reversal pattern. The difference is that the bearish candle does not require engulfing the entire range of the previous candle; only the opening and closing points are critical.
Evening Star Pattern
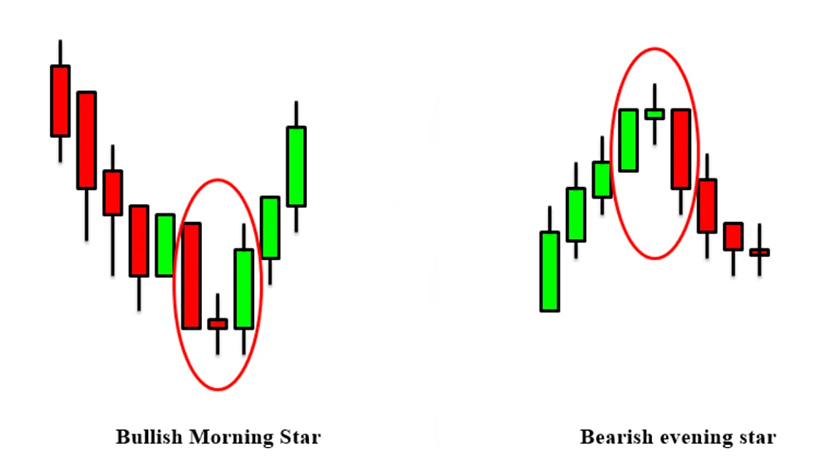
There is a morning star — this candle is considered bullish. In contrast, the evening star is referred to as bearish. When appearing on the chart, it warns the trader of a change from an uptrend to a downtrend. The pattern is formed by three candles:
- A large bullish candle;
- A small candle immediately follows the bullish one, which protrudes above its body (above the closing); when a gap is formed, it provides confirmation that buying pressure remains;
- A large bearish candle completes the pattern.
The formation of the small candle indicates indecision and, therefore, a potential trend reversal. The middle candle is accompanied by a slight stabilization of positions in the market. The subsequent large candle confirms the reversal, and at this stage, you can make decisions regarding your trades. It is especially sensible to do so with confirmation of your observations through additional signals when you use other tools for technical or fundamental analysis.
Bearish Harami Pattern
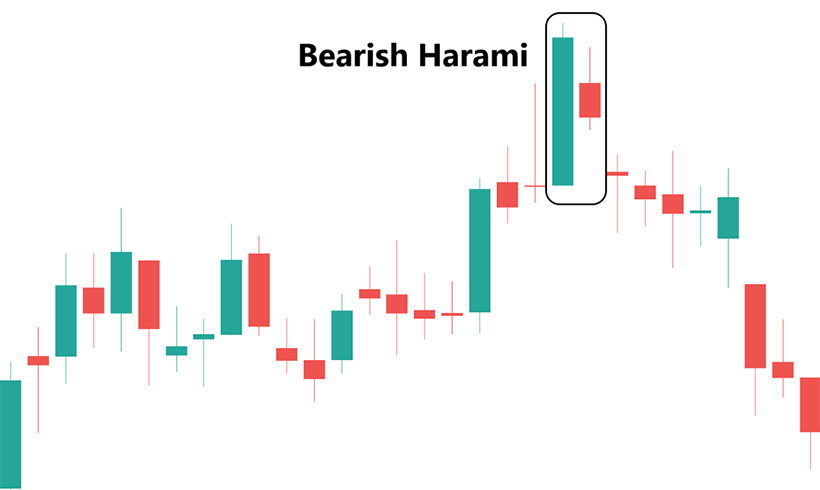
The Bearish Harami is formed by two adjacent candlesticks:
- The first one has a large body;
- The second one has a small body and completely engulfs the first candlestick without exceeding its boundaries.
The Bearish Harami has four different combinations: green-red, green-green, red-green, and red-red. You will need to determine the character of the Harami (bullish or bearish) from the context, considering the previous trend: Harami that appears on the chart after an uptrend are considered bearish. Importantly, the smaller the body of the second candlestick, the more likely a trend reversal is because it indicates a sudden and prolonged buying pressure increase. Steve Nison extensively covered this in his book “Beyond Candlesticks,” so if you want to learn more about how to work with this signal, we sincerely recommend reading this book.
Hanging Man Pattern
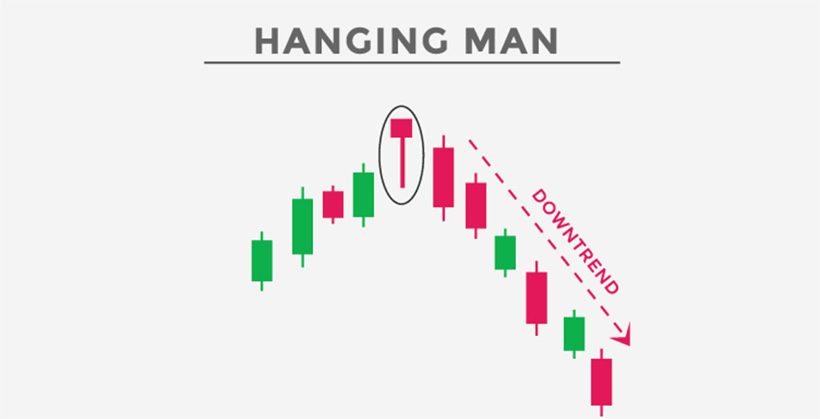
The Hanging Man Pattern is the fourth most popular and common bearish candlestick you can see on your screen. This reversal pattern looks distinctive, making it impossible to confuse with other signals, thus serving as a clear indicator for every trader. The candlestick has a very small real body and a long lower shadow (lower wick of the candle).
This pattern appears on the chart at the end of an uptrend. Its appearance warns the trader that the current price movement is becoming weaker. Bulls have put in maximum effort to push the price higher, but they can no longer continue, and the price will no longer move further up.
The small real body of the candle indicates a very small difference between the opening and closing prices. Pay attention: it is precisely a Hanging Man if the candle has no upper shadow, but the lower shadow is twice as long as the length of the candle itself.
How to use it? When you see a Hanging Man, it's time to open a short position. Therefore, this pattern is best suited for day trading, and if you follow one of the day trading strategies, this pattern can be your reliable assistant in making decisions that lead to highly profitable and advantageous trades.
Identifying Bearish Reversal Candlestick Patterns
Proper identification and interpretation of bearish reversal candlestick patterns will allow you to open or close trades when it is least risky or most profitable for you. By the way, you can read about risks in Forex and effective risk management here.
So, a bearish reversal candlestick is a candle that closes with a price lower than its opening, indicating a downtrend. This is a general recommendation, but you should consider the specific characteristics of each type of bearish reversal candlestick, as they all have their own peculiarities.
Interpreting Bearish Candlestick Patterns
To properly understand the bearish reversal pattern meaning on your chart, you must first study all the variations of this signal and learn to recognize them on charts while understanding the differences in their characteristics. Additionally, it is essential to look not only at the current picture but also consider data from the previous period; this approach provides a more reliable basis for decision-making.
If you are unsure, compare your observations with signals from technical indicators such as RSI, MACD, and others. This way, you can either confirm your hunches and observations or quickly receive information to either close open trades or, conversely, open new ones. Also, consider the market context because if all signals indicate a particular trend and only the candlestick pattern points in the opposite direction, this indicator cannot be considered reliable, and you should not solely rely on it. By considering various factors and using multiple tools for analysis simultaneously, you will obtain more accurate and reliable data to base your decisions on.
Leveraging Bearish Patterns
Bearish signals are extremely easy to use, as they provide you with quite accurate information about trend reversals or downward price movements. To successfully leverage this, you should follow a very simple algorithm:
- Recognize bearish candles on the chart and determine the pattern type.
- Confirm the obtained data with the help of other signals and technical indicators.
- Analyze the market context.
- Pay attention to historical data for the recent period.
- Identify the best entry and exit points in the market.
- Set stop-loss and take-profit levels to protect your assets and limit potential losses.
- Make effective decisions regarding your trades and positions.
Beware of impulsive decisions and short-term market fluctuations, and adhere to your overall trading plan and core trading strategy that you are using.
The Bottom Line
Bearish candles, like other patterns, can become a reliable tool in your trading if you learn to use this instrument correctly. However, never rely solely on one signal and always compare it with indicators obtained from other sources, including considering trends, market dynamics, historical data, economic news, and other information. This will help you trade effectively, take fewer risks, and earn more from your trades than you spend. So, the main advice in conclusion: never stop learning and practicing, even if things don't work out perfectly at first. Only this way leads you to success and allows becoming an expert in Forex trading.