Trends are the basis of most trading strategies. However, it is important to know not only their direction but also their strength to succeed. We will look at indicators that can help you in evaluating trends — momentum indicators Forex. From this article, you will learn how key metrics are calculated, how to use them in your strategies, and how to apply them for risk management.
What Are Momentum Indicators?
Forex momentum indicators are technical momentum analysis metrics that allow you to assess the direction, strength, and stability of a trend. They are based on the same principles used in the laws of physics. By calculating momentum, you can evaluate the "energy" of a trend and find out how far it can go before stopping and reversal.
The momentum Forex indicator shows how likely it is that the price will continue to move in a certain direction. They are also used to determine the level of stability of an asset during periods of market volatility. They allow you to make data-driven decisions, including forming complex strategies and customizing trading robots.
Commonly Used Momentum Indicators
Relative Strength Index (RSI)
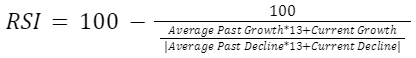
One of the best Forex momentum indicators used by most trading platforms. It demonstrates market conditions and helps to determine the moment of trend reversal. Its formula is as follows:
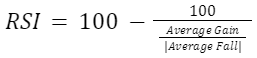
RSI is usually calculated for the last 14 periods — "candles." Periods with positive and negative dynamics are considered separately. If necessary, the number of candlesticks can be changed depending on the nature of the market and the trader's strategy.
As a simplified example, let's consider a situation when for the last 14 trading periods, seven closed with an average growth of 13%, and another seven closed with a decline of 3.8%.

o reduce the time lag, the formula is sometimes modified:
It is also important to know how to interpret the results obtained. An index value above 70% indicates that the asset is "overbought" — its price is overvalued, which may mean a rapid reversal of the uptrend to a downtrend. And vice versa, the number less than 30% indicates "oversold" — the fall may soon be replaced by growth.
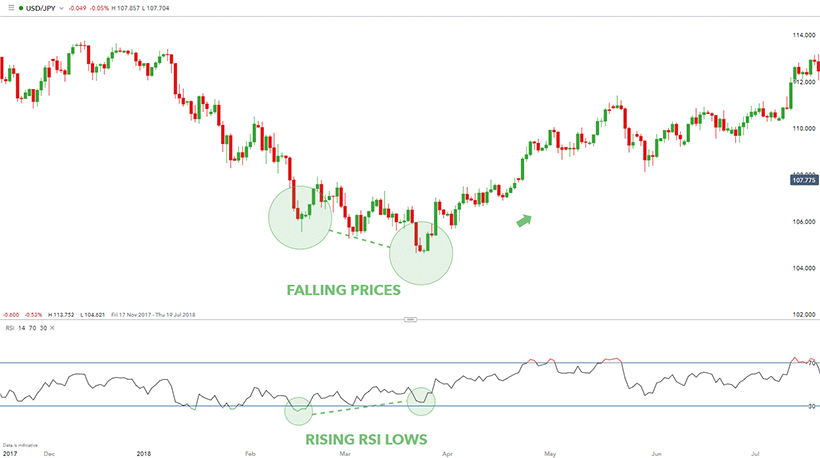
Moving Average Convergence Divergence (MACD)
A rather difficult to understand but an effective momentum indicator in technical analysis. Unlike other metrics, it is read by the chart, not by quantitative values. Two exponential moving averages are used for calculation - one with a longer period and one with a shorter period. Most traders use time intervals of 26 and 12 days respectively. The chart is built according to the formula:
![]()
where EMA is the exponential moving average over a certain time interval.
The second important element of the indicator is the signal line. Its values are calculated as a 9-day exponential moving average from MACD. Such smoothing allows for getting rid of random emissions and filtering out market noise.
The results are interpreted from the chart. When the signal line and the MACD line move in the same direction, the trend continues, and when they diverge, a trend reversal is imminent.
MACD histogram is also used to assess the strength of the trend. For its construction, the values calculated by the formula are used:
![]()
The higher or lower the histogram bars are, the stronger the uptrend or downtrend is.
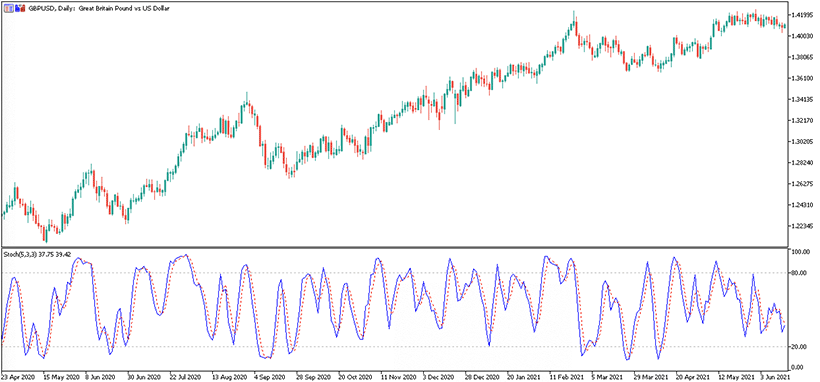
Stochastic Oscillator
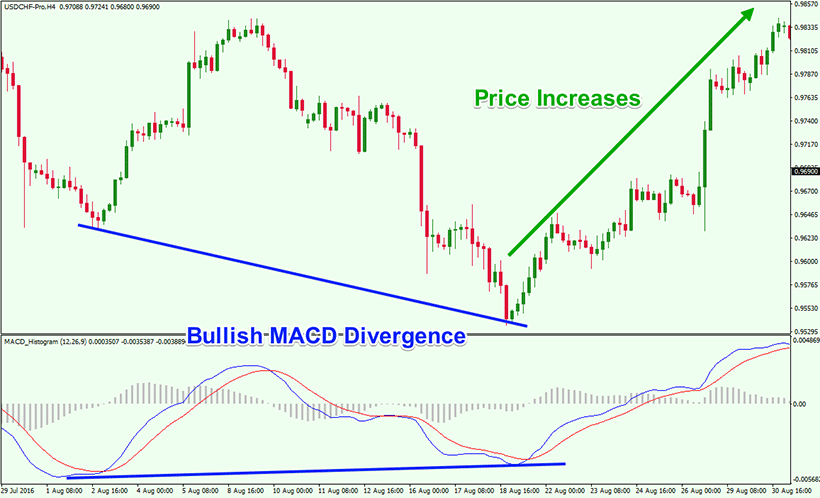
Experienced traders notice that in case of a strong uptrend, the trades close closer to the maximum, and in case of a downtrend — to the minimum. If there is a reversal within the period and the final value moves away from the extreme point, it may mean a close trend break. This is the principle behind the following Forex momentum indicator. It is calculated by the momentum indicator formula:
where C is the current closing price, H14 is the maximum price for 14 previous periods, and L14 is the minimum price for 14 previous periods.
Let's look at a simplified example where in the last session, the dollar to Japanese yen ratio closed at 152. The maximum quote for the 14 previous periods was 156, and the minimum quote for the 14 previous periods was 141. Let's calculate the stochastic oscillator:

In terms of interpretation, this momentum indicator is very similar to the Relative Strength Index. If the value is above 80%, the asset is considered overbought, and if it is below 20%, it is considered oversold. To exclude random spikes, some traders calculate the "slow" stochastic oscillator %D, which is a three-day moving average of the underlying index. The intersection of the %K and %D lines on the chart can be a signal of a trend change.
True Strength Index (TSI)
Using a double smoothing technique, trader William Blau got one of the best momentum indicators in 1991. Unlike other metrics, the True Strength Index has a small time lag. It is excellent for assessing the current situation and predicting prices in the near future. The formula for calculating the index is quite complex, so it is worth presenting it as a series of calculations:
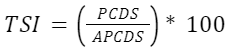
where
PCDS is the price change with double smoothing, and APCDS is the absolute price change with double smoothing. In turn, they are calculated as follows:
PC=Current Closing Price-Previous Closing Price
APC=Current Closing Price-Previous Closing Price
PCS —25-day exponential moving average of PC
APCS —25-day exponential moving average from APC
PCDS —13-day exponential moving average from PCS
APCDS —13-day exponential moving average from APCS
The calculations are quite cumbersome — it is impossible to perform them manually in real time. In this case, you have to rely on specialized software.
Although in theory, the true strength index can take values between +100% and -100%, in reality, its values fluctuate between +30% and -30%. When it approaches these extremes, we can talk about a near-trend reversal. But it is important to realize that each asset has its own turning point — in some currency pairs, it is closer to 20% or even 15%. A positive value is characteristic of a bullish market, while a negative value is characteristic of a bearish market.
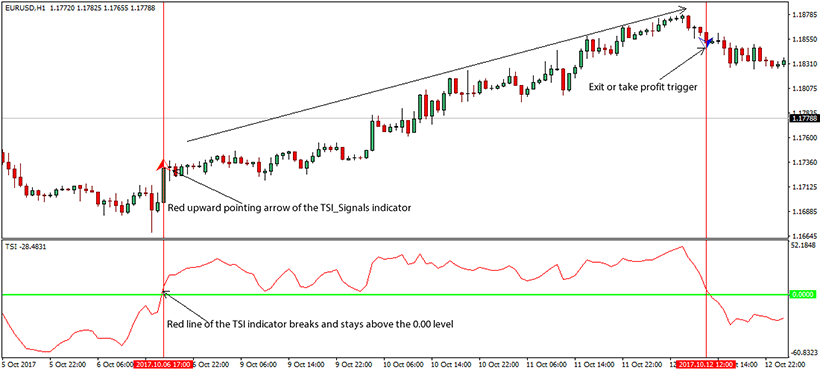
Like other momentum indicators, the true strength index has a signal line, which makes it easier to read the chart. Its values are calculated like the 12-day exponential moving average of the TSI. If the index crosses the signal line from above, it usually indicates the beginning of a downtrend, if it rises from below, it indicates an upward trend.
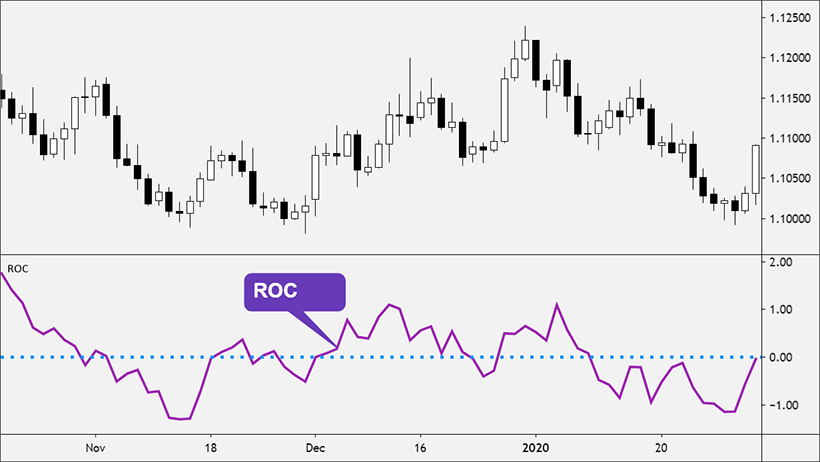
Rate of Change (ROC)
Trading momentum indicators borrow a lot from physics. One of them demonstrates acceleration in price dynamics, allowing you to estimate the strength and direction of the trend. The formula for the level of change is as follows:
![]()
For example, the euro is currently trading at 1.116 against the US dollar, whereas 3 days ago, the rate was 1.099. Let's calculate the value of the index:
![]()
The interpretation of the index is quite simple. When analyzing the momentum, a positive level of change indicates a "bullish" trend, while a negative level indicates a "bearish" trend. The greater the absolute value of the index, the stronger the trend. In this case, a low percentage indicates price consolidation.
One of the problems when using such an indicator is the correct choice of the base period for comparing prices. The optimal time period is selected individually for each asset. Forex traders often operate in the range from 3 to 30 days.
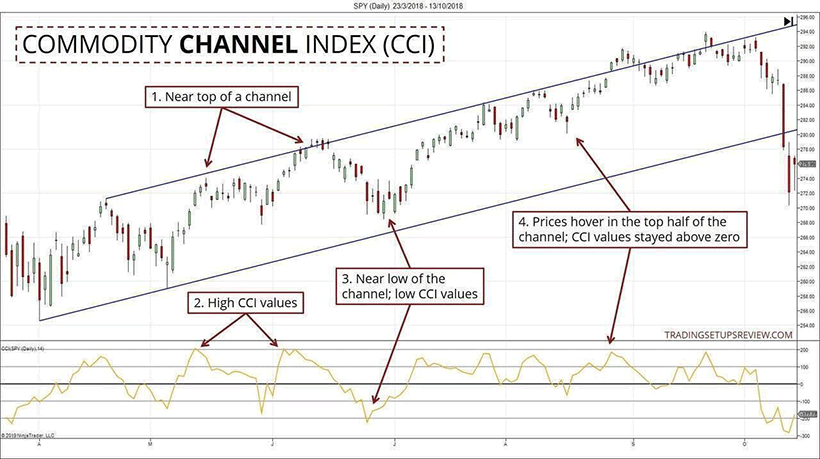
Commodity Channel Index (CCI)
It is one of the indicators for momentum trading, which allows predicting trend reversal quite accurately. It is used both to determine overbought/oversold conditions and to find divergences. The formula is as follows:
![]()
where
TP is a typical price. It is calculated as an average of the minimum price, maximum price, and closing price for the period. In our case, it is necessary to know the average typical price for the time interval under study.
EMA is the exponential moving average for the studied time interval, MD is the average deviation of actual indicators from the moving average, and 0.015 is the fixed coefficient, which does not change during calculations.
The optimal time interval for CCI calculation is 20 days. If the time frame is shorter, the index turns out to be very volatile and weakly filters market noise, if the time frame is longer, it lags behind and does not always reflect the objective reality.
Unlike other momentum trading indicators in the list, the commodity channel index is not limited to the range from -100 to +100%. On the contrary, this corridor is considered normal for most assets. The closer the absolute value of the index is to 100%, the higher the probability of a trend reversal.
If the index goes beyond 100%, the market is considered "overheated." A high positive value of the index, for example, +225% or +300%, indicates a strong uptrend, while a low value indicates a possible fall in the near future.
Average Directional Index (ADX)
It is one of the best momentum indicators that show not only trend strength or reversal points but also direction. This makes it an ideal choice for setting up automated trading algorithms. It is used in the software of the best Forex robots. As usual, the downside of efficiency will be a complex formula:
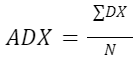
That is, the index is calculated as the average of the directional indices for each period of the studied time interval. In turn,
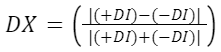
where
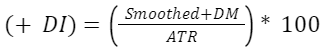
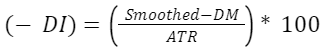
When calculating the momentum technical indicator, the indicator of the average true range ATR is used, about which you can learn more in the article on market volatility. In brief, it represents the average of the maximum corridors of price fluctuations over the period under study. But now, we will be more interested in the smoothed series of positive or negative DM:
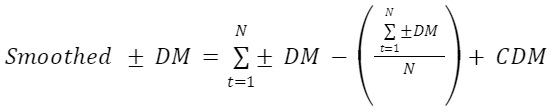
where
N is the number of periods in the time interval under study. Usually, ADX is calculated by the last 14 candles. DM is directional price movement:
Positive movement or + DM = Current high — previous high Negative movement or — DM = Current low — Previous low CDM — current movement in the last period
When you calculate the ADX momentum indicator for at least 2 periods using the formulas, you will need to smooth it out:
![]()
Once again, we are dealing with cumbersome calculations that make no sense to perform manually. Trust the automation — just enable the corresponding option in the interface of your trading platform.
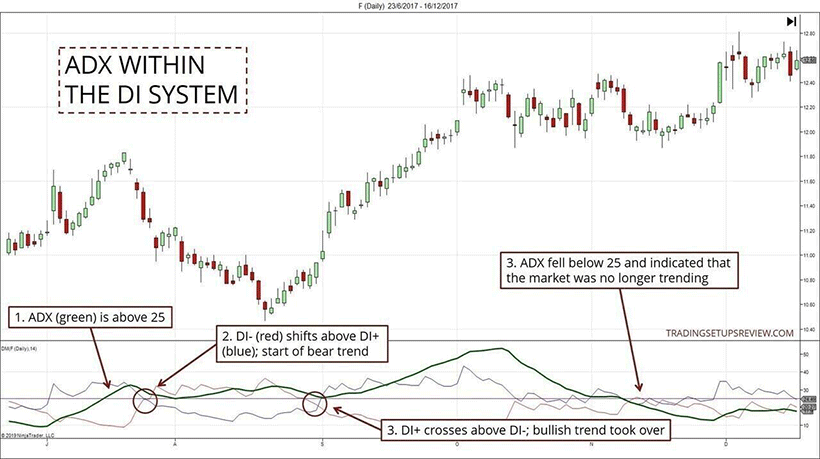
And here, it is very important to know how to use the momentum indicator ADX. Positive and negative movement indicator lines, i.e. (+DI) and (-DI), are drawn on the chart. The moment of their crossing means a change of trend. If +DI rises from the bottom to the top, it indicates an upward trend, if -DI — a downward trend.
The ADX indicator also has a high value. It is interpreted as follows:
- A value of less than 20 units indicates no trend or a weak trend;
- Between 20 and 25 units — a moderate trend with a clear direction;
- Over 25 units — a strong trend.
Practical Application of Momentum Indicators
Knowing how to read momentum indicators, you can use them as follows:
- Choose assets that match your trading strategy. If you prefer to open short-term trades, you should focus on strong trends that give sharp outliers and often break the boundaries of price corridors.
- Plan your entry and exit points. Most indicators we have reviewed allow you to understand when a trend is approaching a reversal point. As a result, you can determine the ideal moment to open and close orders to increase the volume of profits.
- Determine the direction of medium- and long-term trends. Beginner traders often confuse random fluctuations with stable trends. Simple and voluminous momentum indicators that display the strength of the trend come to their aid.
Trading Strategies with Momentum Indicators
Like other indicators, these indices can be interpreted in different ways. In addition, their correct interpretation will largely depend on the context, i.e. the current market situation. Knowing what the momentum indicators represent, you can form the following strategies:
- On the cusp of a trend. When quantitative indicators go out of bounds or lines on the chart cross, it often means a change in the direction of price momentum. This means an ideal moment to open or close orders, as well as to move from short positions to long positions and vice versa.
- On the movement in the price range. Stabilization of momentum indicators means a decrease in market volatility. It is usually accompanied by small fluctuations that take into account the general direction of the trend. This is an ideal moment for short-term trading with a small amount of profit, including scalping.
- For a breakout. A sharp strengthening of the trend may mean entering a new price range. In such a case, it is important to set stop losses and take profits correctly to maximize profit and minimize risk.
Many trading strategies are also based on the concept of divergence. If the dynamics of the momentum indicator do not coincide with price fluctuations, it often indicates a weakening trend. Depending on other market characteristics, the further development of events can be either a reversal or an exit into a rigidly fixed price range.
Managing Risk with Momentum Indicators
Most types of momentum indicators are suitable both for selecting optimal market entry moments and for insurance. The tactics will be fairly simple:
- High indicator values usually indicate an overbought asset. By studying the charts and the correlation between the indicators, you can predict what the price will be at the peak and set the take profit a little lower to ensure that you close the deal and make a profit.
- Negative values indicate oversold. Similarly, you can predict the minimum price level. This allows you to set your stop loss just below the bottom. On the one hand, such a decision will insure you against unexpected breakouts, and on the other hand, it will prevent accidental closing of orders.
- Anomalies like chart divergence indicate that the market is preparing for dramatic changes, including a change in trends. If you prefer low-risk strategies, at this point, it makes sense to close existing orders with the current profit level.
Conclusion
Momentum indicators are some of the most important metrics of momentum technical analysis. By showing the current strength of the trend and the acceleration of the quotes dynamics, they allow you to predict the price for the near future. They can also be used to find reversal points to choose the optimal moment to open and close trades. Impulse indicators are used in various trading strategies, including when setting up trading robots. However, it is important to remember that each indicator has both advantages and disadvantages. Therefore, you should not base your strategy on only one index — it is better to rely on a complex matrix of indicators and make situational decisions in accordance with the current market situation.