Chart analysis tools play a crucial role in making informed trading decisions when trading on financial markets. Indicators are an essential aspect of technical analysis as, with their help, traders get vital information about the market condition and help predict its future movement. Utilizing relevant indicators can give a competitive edge in trading and contribute to success. While numerous indicators are available, traders often rely on the most informative and popular ones. One of them is the MACD indicator Forex, which holds a significant position in the toolkit of many traders.
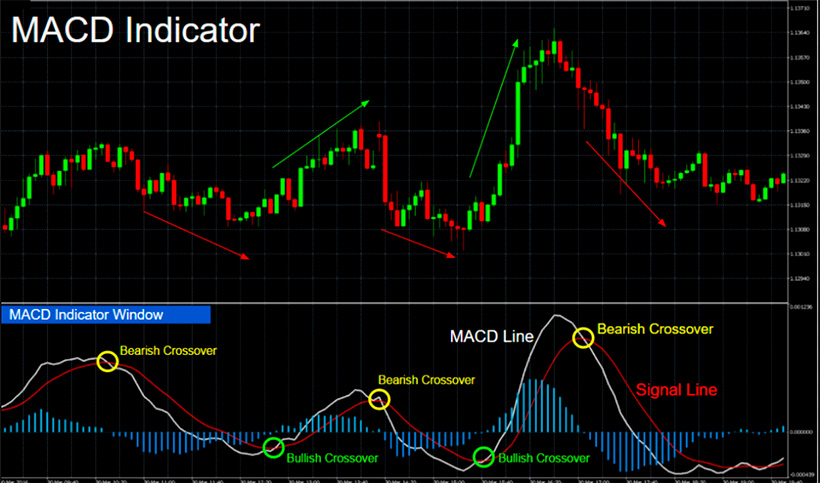
The MACD indicator allows traders to gain additional insight into buy and sell signals and changes in market trends. The visual representation consists of three components: the MACD line, signal line, and histogram, which shows the disparity between the two. Thanks to this visual representation, traders perceive the signals provided by the MACD more easily.
So let's discuss its workings, the different types of signals it provides, and trading strategies that incorporate the MACD. Understanding these aspects will help you correctly identify MACD signals and utilize them to enhance your trading decisions.
What is the MACD Indicator?
Even using the best Forex robots requires knowledge of technical and fundamental analysis, as even configuring them requires understanding potential success strategies. Moving Average Convergence Divergence helps to detect trend changes, determine when to buy or sell, and confirm the trend's strength.
The Forex MACD indicator has three components:
- The MACD Line serves as a valuable instrument in gauging market dynamics by calculating the variance between two exponential averages, usually spanning across a 12-period and a 26-period timeframe. Its primary objective revolves around recognizing pivotal changes in prevailing trends.
- In conjunction with the MACD Line, we encounter the Signal Line, which emerges as a 9-period exponential average derived from the MACD Line itself. This particular component finds widespread application in generating actionable signals for both buying and selling decisions.
- Moreover, a histogram emerges as an insightful visual representation, showcasing the disparities between the MACD Line and the Signal Line. Should the values assume a positive stance, it indicates a robust growth trajectory within the market, whereas negative values allude to a gradual weakening of market conditions.
Short guidance on identifying MACD Forex signals by looking at the chart
On a technical analysis chart, the MACD indicator appears as lines and a histogram below the price chart. This tool generates buy and sells signals based on the crossing of the MACD Line and Signal Line, regardless of the direction. Let's consider an example of what is MACD in Forex and how the MACD indicator works. If you look at the chart, you'll see that when the MACD Line crosses the Signal Line from below to above, it's a bullish signal that suggests you should buy. On the other hand, if there's a reversal crossing from above to below, it could indicate a sell signal.
It's crucial to acknowledge that the MACD is not a one-size-fits-all indicator, and its effectiveness is greatly enhanced when employed alongside other analysis tools and trend confirmation techniques. By carefully assessing its distinctive features and aligning them with prevailing market conditions, traders can leverage the power of MACD to make well-informed and astute trading choices.
How does MACD work on Forex?
Forex trading with MACD, along with other fundamental analysis tools, gives you an understanding of potential trend changes and generates buy and sell signals. The main idea behind using MACD is to compare two exponential averages to identify moments when the asset price is most likely to change.
To make Forex MACD trading as successful and profitable as possible, you should follow the following instructions:
- To begin, initiate the process by carefully selecting the optimal parameters for the MACD indicator. Typically, 12, 26, and 9 values are commonly employed for the fast, slow, and signal lines, respectively. Nevertheless, adapting these values according to your unique requirements and trading strategy is crucial.
- Watch the MACD and signal line interaction. When MACD rises above signal, buy. When MACD falls below signal, sell.
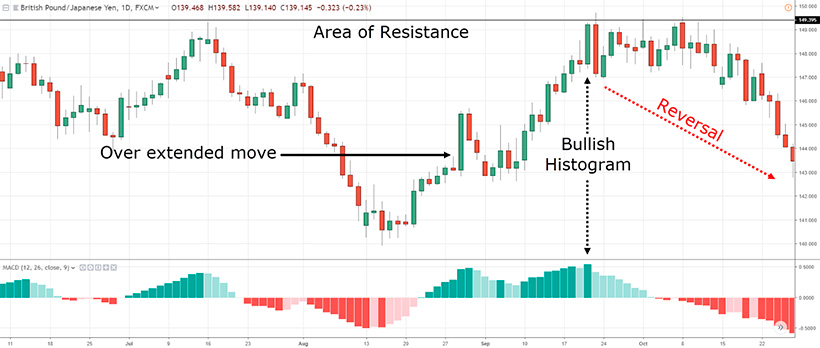
- The MACD histogram is an essential component that reveals the disparity between the MACD and signal lines. An escalation in the histogram can suggest a strengthening trend, while a decline may indicate a weakening trend. Changes in the histogram can also serve as vital signals for initiating positions.
- The MACD can be effectively combined with other technical indicators or confirmations to bolster decision-making. For instance, observing the movement of average prices or identifying support/resistance levels can further authenticate the signals generated by the MACD.
Of course, using this indicator, like any other, requires practice, market analysis, and testing of different Forex trading strategies MACD. However, ultimately, these efforts are worth it as they pay off. If you apply an effective strategy and manage risks correctly, you can achieve a significant level of professionalism and consistently profit from Forex.
How to effectively use the MACD indicator for Forex trading?
Now that you know how this indicator works and how to recognize it on a chart, the next task is to learn how to use MACD Forex in practice. In other words, the next step is to understand how to build a MACD Forex strategy based on the indicator's signals.
- MACD line above signal line = good time to buy. MACD line below signal line = consider selling. So, when using MACD Forex, you can look for crossings of the signal lines.
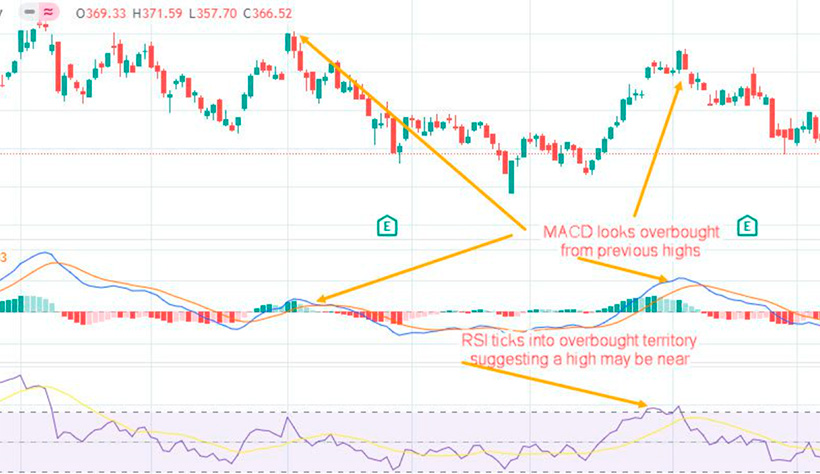
- MACD can be used as an oscillator by observing divergences between the indicator and the price. A significant divergence can indicate a potential price correction.
- Divergences between the MACD and the price can provide valuable indications of potential trend shifts. A bullish divergence materializes when the price establishes lower lows while the MACD histogram experiences an upward surge. This phenomenon often acts as a clear signal to consider buying opportunities. Conversely, a bearish divergence manifests when the price attains higher highs while the MACD histogram declines. Such a scenario can serve as a noteworthy signal to contemplate selling positions.
It is essential to carefully analyze these signals and use additional confirmations, such as moving average indicators or support/resistance levels. Considering the market context and managing risks using stop-loss and take-profit orders is also significant. Additionally, remember that MACD is most effective in market conditions with a clear trend. Therefore, it is worth assessing the presence and strength of a trend before using MACD.
Advantages and disadvantages of Forex MACD trading
Let's discuss its advantages and disadvantages to provide a balanced view on whether you should add Forex MACD to your toolkit.
Pros:
- MACD is a relatively simple indicator that is easy to interpret and apply in technical analysis.
- Traders can use MACD to receive signals about changes in market trends, which can help them spot possible opportunities for buying or selling.
- The MACD indicator provides several types of signals, such as crossover of signal lines, overbought/oversold levels, zero line crossings, and divergences, allowing traders to choose the one that best suits their trading strategy.
Cons:
- Due to its reliance on moving averages, the MACD indicator is prone to lag behind real-time price fluctuations. Consequently, traders risk missing out on specific market movements or receiving delayed signals, potentially impacting their ability to capitalize on lucrative opportunities promptly.
- Like other indicators, the MACD is susceptible to producing false signals, particularly when confronted with low volatility periods or when the market exhibits sideways movement. These false signals can lead to undesirable outcomes, such as unprofitable trades or missed profit potential.
- Furthermore, it's essential to acknowledge that the effectiveness of MACD can be compromised in rapidly changing market conditions or during pronounced trends. When prices undergo swift alterations, the indicator may exhibit reduced accuracy or generate perplexing signals, introducing complexities and challenges for traders seeking reliable insights.
The Bottom Line
MACD provides traders with valuable information about buying and selling signals and changes in market trends. It's essential to keep in mind that relying solely on one indicator is not a reliable trading strategy.
Successful trading requires comparing different data and employing a comprehensive approach. If you enjoy using MACD, combining it with other indicators that complement its signals and provide additional advantages is recommended. For example, indicators such as RSI (Relative Strength Index), Stochastic Oscillator, or Bollinger Bands are going to be excellent additions to your trading strategy.
Learning to compare different data and use various indicators may initially seem challenging. However, with practice and experience, you can quickly assess information and open more profitable trades, improving your trading results.