Although stock trading has its specifics, it is also subject to market laws. We are talking about conjuncture, i.e. the ratio of supply and demand, as well as psychological factors. Relying on them, you can improve your trading strategies, increasing the level of profit. Let's find out what resistance and support in Forex are, how to identify them, and how to use them in trading.
What Are Resistance and Support in Forex?
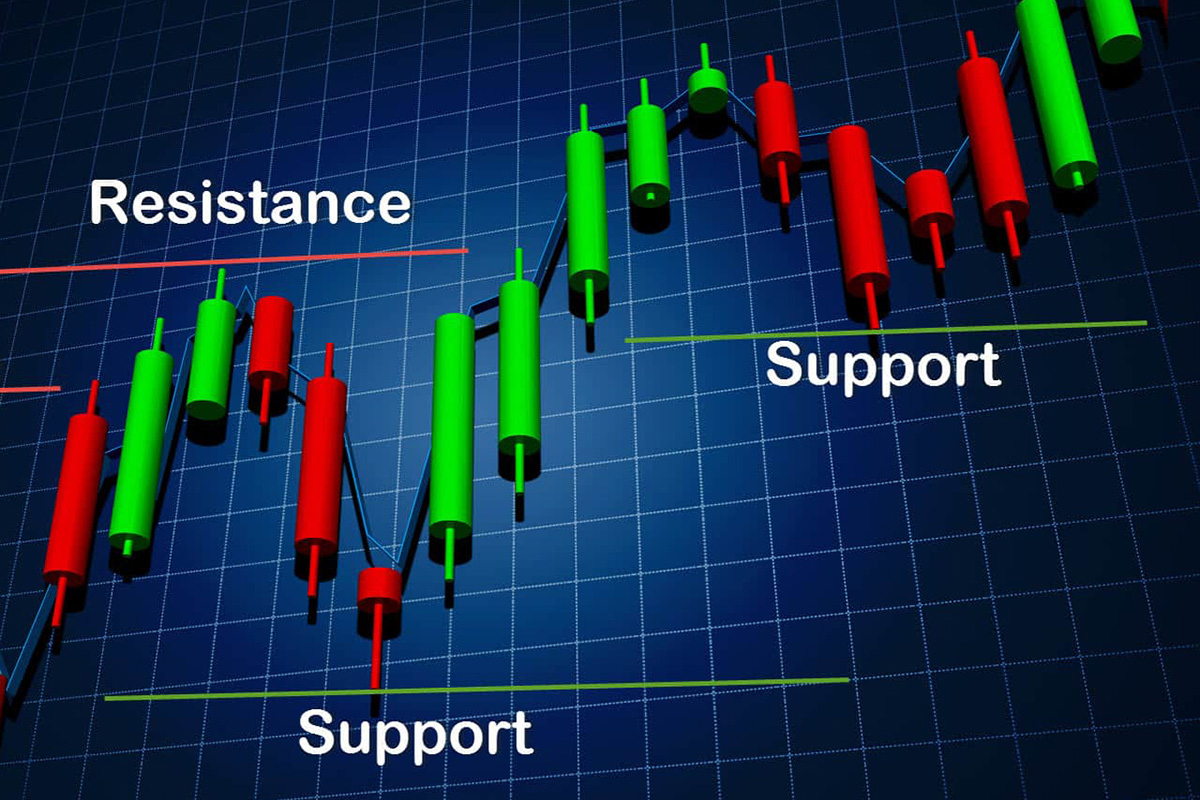
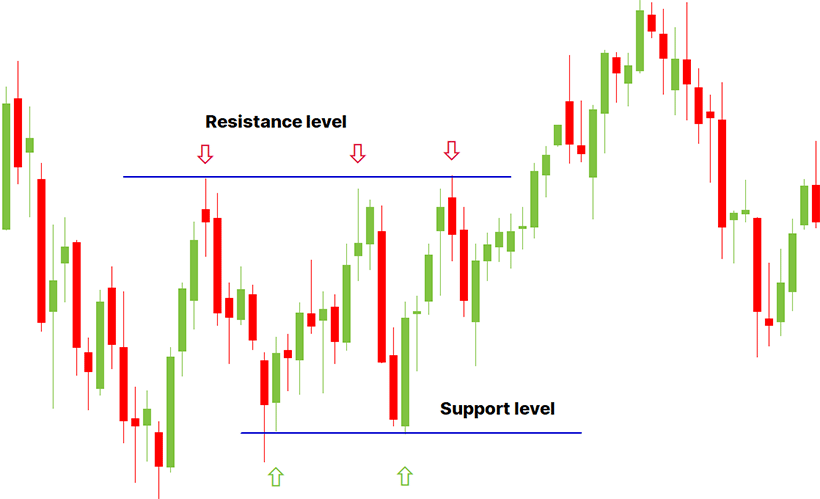
Forex support and resistance levels are prices that can reverse a trend, sending the dynamics in the opposite direction. They are often used in technical analysis, although they do not have standardized formulas for calculation. Moreover, the mechanism of their action is rather stochastic, i.e. probabilistic — there are no 100% dependencies.
Support level is the price at which an asset is considered undervalued. It stimulates demand, which leads to the opening of a large number of orders. Traders see the potential for value growth and, therefore, invest in this market.
The resistance level is the price at which the asset is considered overvalued. Supply significantly exceeds demand, which leads to selling and closing orders. Traders expect that the value, having reached its peak, will decline, and therefore, they try to make a profit "at the top."
Types of Resistance and Support Levels
Most often, experts talk about horizontal lines. Such support and resistance Forex levels represent the lower and upper boundary of the price corridor. Approaching them, the price pushes back, breaking the trend.
However, you should remember that any market is dynamic — the situation in it is constantly changing, bringing the price outside the established corridor. That is why experienced traders are guided by trend Forex support and resistance levels. They are oblique lines, the angle of inclination of which shows the general tendency to price changes in the medium and long term.
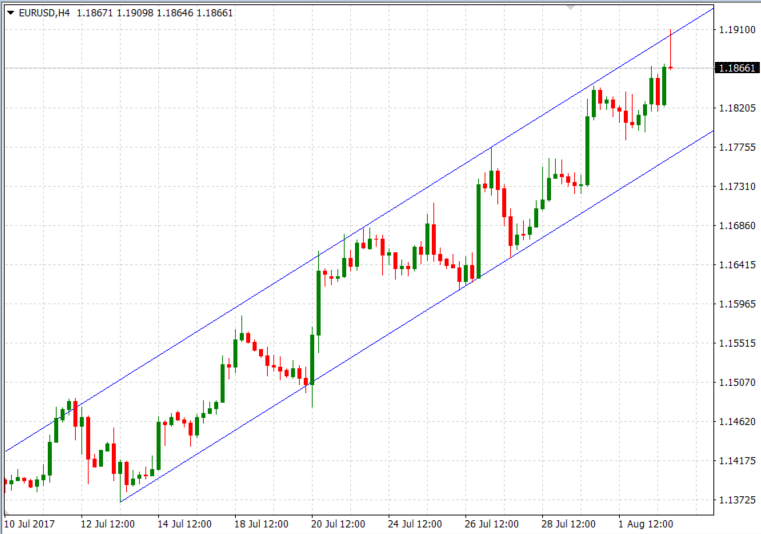
From a mathematical point of view, a trend can be expressed as a certain "a" coefficient. Then, in an upward trend, the next peak will be reached at the level max+a and the next bottom — at min+a. In a downtrend, it will be max-a and min-a levels.
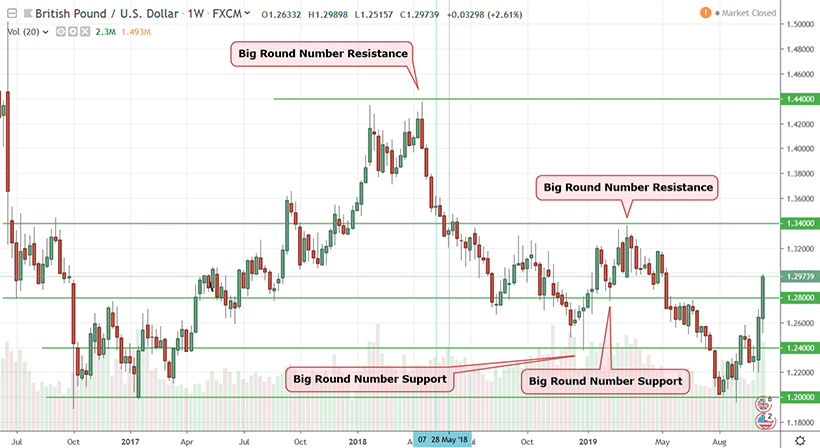
Forex support and resistance indicators are often round numbers. This can be easily explained from a psychological point of view. Our brain unconsciously tends to simplify, so we often round fractional numbers in conversation. This pattern also applies in trading — many market players specify round numbers in orders, which leads to large-scale closing of orders when these numbers are reached.
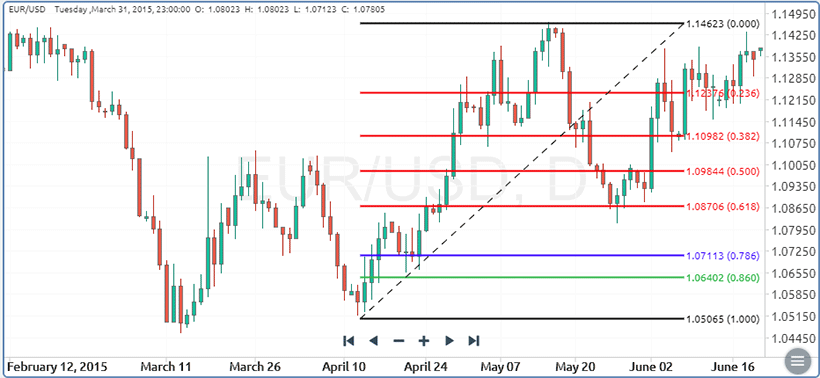
To learn about trading support and resistance, it is also worth having an idea about the Fibonacci sequence. It is a set of numbers connected with each other by the so-called golden correlation or golden ratio. By dividing each of them by the previous one, you get the same ratio equal to 0.618 or 61.8%. Practice shows that the ratio between support & resistance lines at different levels often follows the same rules. This allows you to predict within which limits the dynamic price will be set.
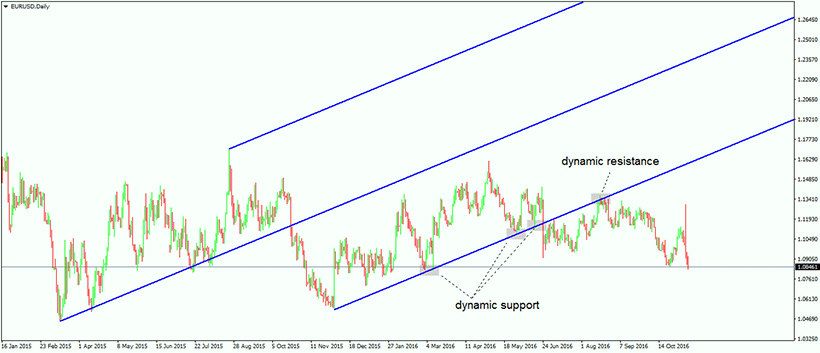
Some resistance and support trading techniques use dynamic levels. As their name suggests, they take into account the change in price over time. Such indicators are chosen situationally, but in Forex, they are often exponential moving averages over time periods such as:
- 50 days;
- 100 days;
- 200 days.
Drawing and Recognizing Resistance and Support Lines
The main difficulty lies in the fact that there are no general rules for determining the price corridor. Each market is unique — it obeys its own regularities and has its own trading methods. That is why many traders follow an experienced way, gradually improving their strategies.
However, knowing what is resistance and support in Forex, we can formulate a few rules:
- Choose the optimal time frame. In markets with high volatility, it varies from 2 weeks to 3 months, and in those with low volatility — from 3 to 12 months. There is no point in diving deeper into historical data — they were formed under unique circumstances, which do not exist at the moment.
- If the lines are close to significant psychological milestones, round up. This especially applies to fractional prices with a large number of decimal places. Practice shows that traders rarely use more than two digits — you can stick to rounding to hundredths.
- Remember that indicators for support and resistance change the places when the lines are broken. If the price under the influence of a certain factor falls below the support line, it becomes the resistance line — the new upper boundary of the corridor.
- Test different hypotheses. Try overlaying horizontal and trend lines on the charts, and use the Fibonacci series and moving averages. Change time frames within specified limits. Choose those options that better describe the current market situation.
- Do not overcomplicate. Support & resistance lines in Forex trading obey fairly simple patterns. If they can't cover all the peaks and dips, no big deal — the overall trends are much more important.
Using Support and Resistance in Forex Trading
It is important to realize that no strategy will give you a 100% guarantee of profitability. Much will depend on the context, i.e. the current market situation. Therefore, it is unwise to bet only on one methodology. It is much better to create a complex trading system, which will be based on a matrix of indicators, using insurance and reinsurance to compensate for risks. This approach often seems too confusing to novice traders, but they have an alternative option — to use a ready-made Forex support and resistance strategy embedded in a trading robot.
Breakout strategies
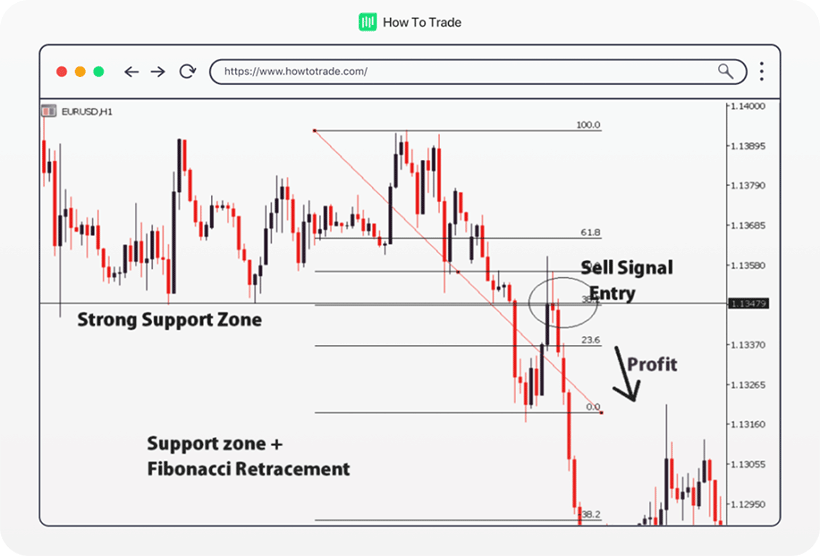
These strategies are based on the assumption that the breakout of lines leads to a change in the price corridor. Roughly speaking, Forex support and resistance indicators are used as starting points for opening orders. The breakthrough of the resistance level serves as a signal to buy, the support level — to sell.
Strategies of this type can be divided into two categories:
- Aggressive. Assume buying directly at the moment of breakthrough. They increase the volume of potential profit, and with it — the level of risk.
- Conservative. The order is opened not after the breakthrough but after the surge, rollback, and repeated movement in the right direction. This insures you against the risk of a false breakout, after which it is possible to return to the previous price corridor.
Most Forex support and resistance strategies based on breakouts use Fibonacci sequences. With a high degree of probability, they allow you to determine the limits of the next price range.
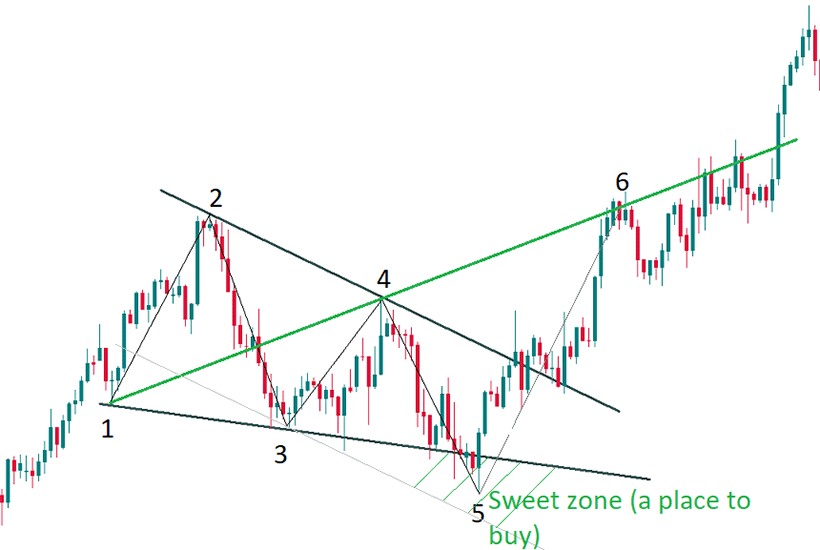
When customizing the best Forex robots, other techniques are also used. For example, Wolf waves are based on the classical law of physics, which states that every action has its counteraction. The theory indicates that many market price fluctuations consist of five waves. In turn, they form six extreme points:
- The first serves as the base of the figure.
- The second displays a major swing but does not necessarily break the lines.
- The third is a new low, which always breaks the bottom.
- The fourth is a local high.
- The fifth is a new low that always goes beyond the amplitude of the third point.
- The sixth is an exit to a new level, accompanied by a breakdown of the previous lines.
Range-bound strategies
These strategies are based on the assumption that the price of an asset will remain within a rigidly fixed corridor for a long period. As a rule, this happens in markets with balanced market conditions and stable investor sentiment. In the case of Forex, these can be strong currency pairs like the euro and the dollar, the British pound and the euro.
Knowing how to find support and resistance will actually give you levels to set stop losses and take profit levels. They can also be used to set up robots on automated trading platforms. As a rule, a stop loss is set slightly below the support line — the defense mechanism is triggered when it is broken and there is a risk of entering a new range. Take profit can be placed on the resistance line or slightly below it depending on your priorities.
A signal to enter the price range can be a significant decrease in the volume of transactions. The market "cools down," as a result of which the probability of breakouts decreases significantly.
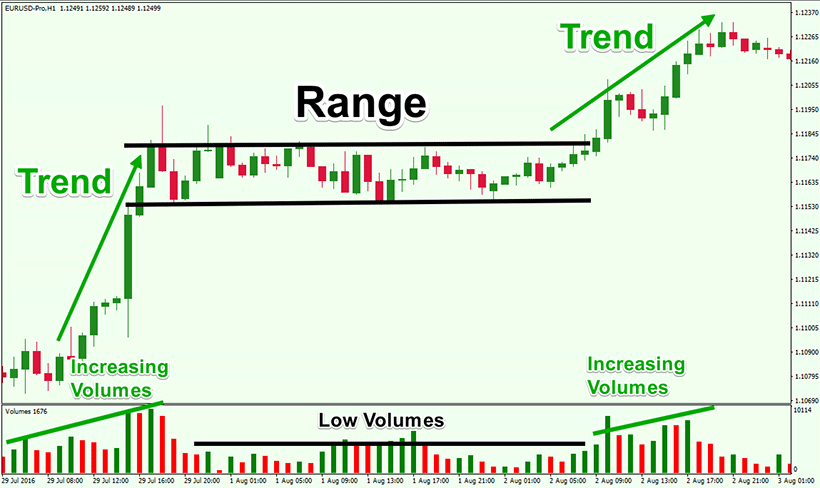
Returning to the previous trading volumes often means exiting the price corridor. In this case, you should have insurance — orders that will be opened when the upper or lower boundary is broken.
Trend reversal strategies
These strategies are based on the assumption that any trends change direction at a certain moment, as a result of which the price fall is replaced by growth and vice versa. In this case, it is very important to follow the trends. Therefore, trend series and moving averages often become support and resistance Forex indicator.
A breakthrough beyond the line can mean a change of direction. For example, in an uptrend, each subsequent low is higher than the previous one. If a new low falls downward, it can be a signal of a trend reversal.
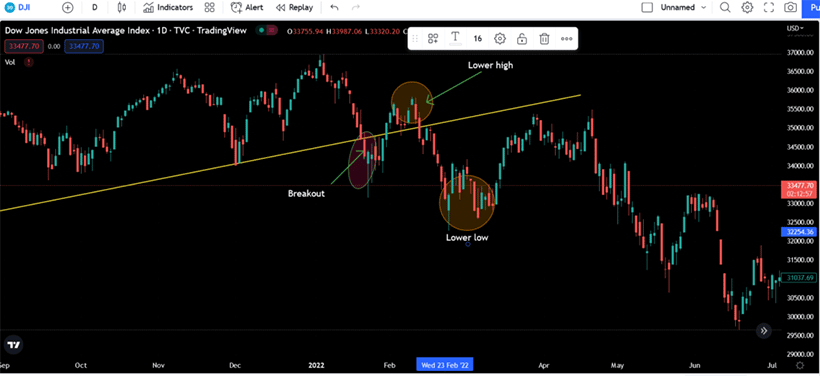
Trend reversal strategies can also be divided into two groups. Aggressive ones imply conducting trades immediately when the resistance/support indicator is overcome. Conservative ones are included at the next wave — they insure you against a false break, which may turn out to be a temporary correction.
Conclusion
Support and resistance Forex are important concepts of technical analysis. They represent the extreme points of the market where an asset is overvalued or undervalued. Based on them, a short-term trend often changes its direction, resulting in wave-like fluctuations on the chart.
Knowing what is support and resistance in Forex, you can build your own trading strategy based on the breakout of these levels, trend reversal, or movement in the price range. However, it is important to realize that they will have both advantages and disadvantages, including risks. Therefore, you should always keep an eye on the current market situation and take steps to insure yourself.
When drawing support & resistance lines, adhere to the recommended timeframes determined by the market volatility. Test different hypotheses but don't overcomplicate. And remember that resistance and support are often zones rather than clear lines — real indicators may push back earlier or go beyond the estimated levels.