Most traders actively focus on the optimal moment for market entry. This is a really important skill that allows you to catch a trend and make good money. However, if you do not know how to exit positions, you risk losing a significant portion of your profits.
Receiving stop and reversal signals is critical to setting smart stop losses. You can use traditional trading tools like moving averages, but they can force you to exit a trade too early when a curve makes sudden reversals or too late at the end of a new move.
An interesting indicator that allows you to accurately track the behavior of the trend with an accuracy of one bar is Parabolic SAR (PSAR). It got its name from its geometric shape, reminiscent of a parabola. The index was first described by prominent technical analyst Welles Wilder in "New Concepts in Technical Trading Systems." In this book, he introduced the PSAR and some other tools that currently form the basis of technical analysis. In this article, we will introduce the indicator and show you how to use Parabolic SAR in Forex trading.
What Is Parabolic SAR?
The abbreviation combines two actions that the curve can make: “Stop and Reverse." This is a trend metric with minimal lag that can be used on almost any time period. It is this factor, together with great prediction accuracy, that has become the reason for the considerable prevalence of Parabolic SAR Forex. PSAR demonstrates who is stronger — bears or bulls — and allows you to define in advance the prerequisites for a direction change.
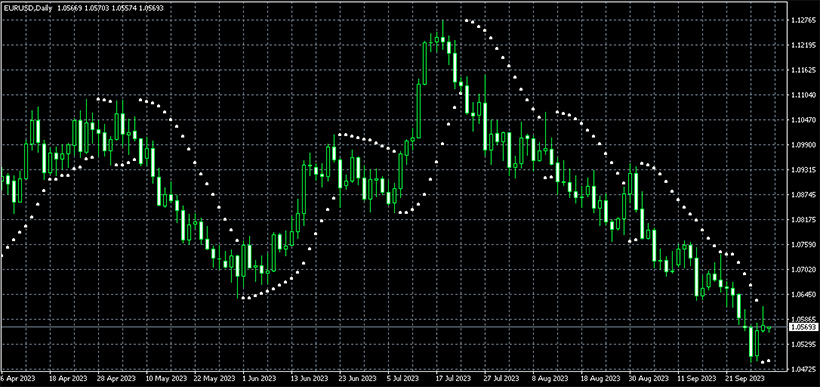
Graphically, the signal looks like consecutive dots, corresponding to candles. In an uptrend, the dots are situated under the curve, and in a downtrend — above. When a reversal happens, the next dot transfers to the opposite side of the curve. Parabolic SAR can be successfully used as a stop loss and trailing stop level.
How Parabolic SAR Works
What is Parabolic SAR in trading? It works well on bullish or bearish charts but not on flat ones. The creator of the indicator, Wilder, recommended first identifying a trend and then applying the SAR. If the graph is upward, you should buy when the meaning moves below the price. If the trend is going down, you should sell when the meaning rises above the price.
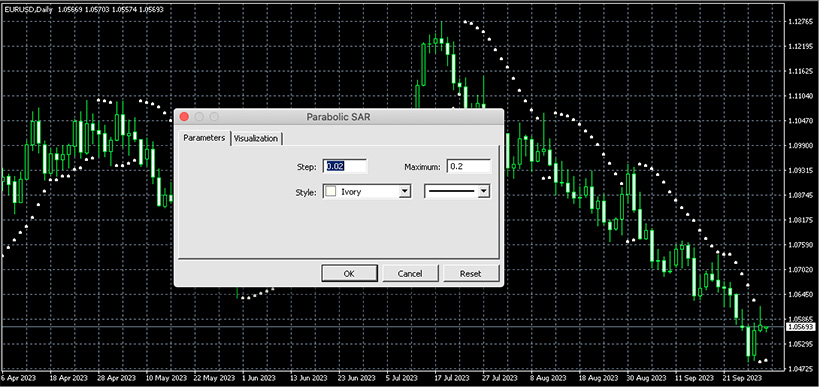
To configure the index, only two variables are set: step and maximum value. The bigger the step, the more sensitive the dotted curve will be to price changes. If the step is extremely high, the indicator will fluctuate continuously, making it quite difficult to interpret and make decisions.
The maximum value adjusts Parabolic SAR as the price moves. It greatly affects the trailing stop, which is going to be further from the graph for lower SAR max values. It is good to set up the step value to 0.02 and the maximum value to 0.20, according to the indicator’s inventor. The SAR can be used on any digital and tangible assets with prevailing trend movements. However, it is not recommended to trade on charts with a time range of less than one hour.
Obviously, the marker is not recommended for use when prices fluctuate within the same range. During sideways tendencies, Parabolic SAR meaning gives a high percentage of erroneous signals. Therefore, to use it safely, it is necessary to exclude flat trading. To do this, you can use Bollinger Bands or other similar tools. Then, using the PSAR, you confirm that the trend is accelerating. When the dots change position, a signal for a curve reversal occurs.
How to Calculate Parabolic SAR
The Parabolic SAR indicator is calculated by an algorithm using two formulas. The first is used for an upward trend:
PSAR(i) = (HIGH(i-1) - PSAR(i-1)) * AF+PSAR(i-1)
The second is for downward trends:
PSAR(i) = (LOW(i-1) - PSAR(i-1)) * AF+PSAR(i-1)
Where:
PSAR — Parabolic value - with index (i) – current, and with (i–1) previous to the calculated one.
HIGH — maximum price.
LOW — minimum price.
AF — acceleration factor. Its value increases with every consecutive step when new price values are reached. Wilder advises using a starting odds of 0.02, which increases by 0.02 with each new bar until it reaches 0.2.
Formula AF:
AF = 0.02 + ix * K
Where:
ix — the number of periods accumulated since the beginning of the count;
K — price change step, which by default is 0.02.
Many people change the acceleration factor. They adjust the initial step size (0.02) and the maximum value (0.20). Some increase them to make the system more sensitive, while others decrease them to make the system react more slowly. The initial pitch typically lies between 0.015 and 0.025, and the maximum AF value ranges from 0.18 to 0.23.
Interpreting Parabolic SAR Signals
The signal to execute a transaction is the intersection of the price curve and Parabolic SAR, which indicates a complete or temporary end or reversal of the curve. When the indicator is turned, its next values are located on the other side of the price graph.
How to read Parabolic SAR? It is very easy. Obviously, if the dots are below the candles, this is a buy signal, and when the dots are above the candles, this is a sell signal. This is probably the easiest index to use, as it assumes that the price is moving either up or down. At the same time, it is worth remembering that this tool is best used in trending markets, which are characterized by long rallies, and in no case should you use it during sideways movements.
Using Parabolic SAR in Forex Trading
Most often SAR signals are used for making a trailing stop, where the current indicator’s value is a stop only for the current bar. Inexperienced traders often lose money because they wait too long for the market to reverse. Parabolic SAR protects them from indecisiveness and disciplines them.
If you are trading up or down and prices are not changing, Parabolic SAR will give you a signal that your entry timing is wrong. You don’t have to sell or buy unless you are confident that prices will go up or down almost immediately after the transaction.
When a trend is stable, PSAR is extremely useful. If prices go up or down without pullbacks, it can be really challenging to set stops correctly using conventional charts and criteria. Under these circumstances, the SAR metric is a decent tool for choosing a stop level.
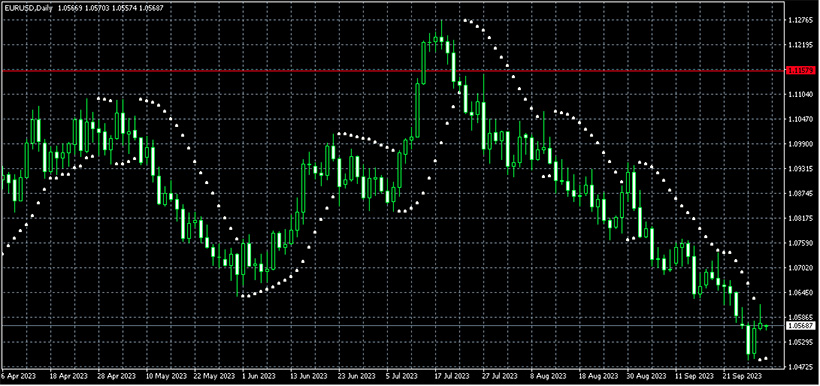
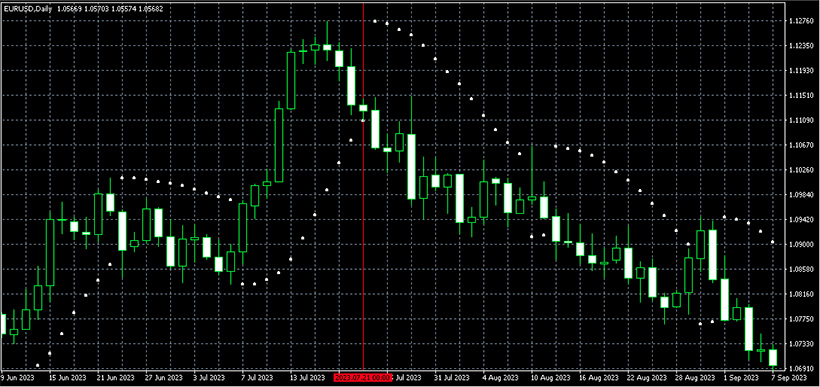
The Parabolic SAR indicator is optimal for setting take-profits and stop losses. Its curve always has a small delay relative to the price graph, so a stop can be placed at the level of the current value of the instrument. The place of a take profit (shown by a red horizontal line) is usually where the parabola is as close as possible to the price graph or has already crossed it.
Many traders enter a trade immediately after the SAR has moved to the opposite side. Experts recommend waiting until the tendency is confirmed by at least three to four dots. Otherwise, it may happen that it was just a correction of the trend, not a reversal. In this case, the market’s tendency will continue, and the investor's entire Parabolic SAR strategy will be based on the wrong signal.
When a new trend forms, its power can be determined by the distance between the dots. The more the space between the dots, the stronger the tendency. It is not a good idea to make a trade if the curve has been in effect for quite some time. The likelihood that the graph will change its direction is constantly increasing, so there is a risk of making a transaction just before the reversal.
Advantages and Limitations
Over almost 50 years of its existence, Parabolic SAR has repeatedly confirmed its usefulness for traders. No matter what strategy you follow, the indicator will give you signals that, if interpreted correctly, will help you make more profits. If we summarize the numerous advantages of PSAR, we can highlight the following points:
- The indicator confirms the trend. As long as the parabola continues to grow, you can be sure that a directional movement will develop.
- The strength of a trend to some extent correlates with the distance between dots. When the gaps contract, you should prepare for a reversal.
- A minimum of false signals and small delays in directional market movements.
- Thanks to the indicator, it is easy to set a stop loss.
- By carefully observing all the, you are protected from Parabolic SAR trading against the market tendency.
Does this mean that the SAR Parabolic indicator is perfect? Of course not. Like any other technical tool, it has its drawbacks. Among them are the following ones:
- Parabolic is not appropriate for flat trading. It is good only for trend periods.
- On small timeframes, the indicator shows extremely high sensitivity to market noise. It is recommended to use it on charts from H1 and higher.
Best Practices for Effectively Using Parabolic SAR
The high accuracy and ease of use of PSAR are the reasons why this indicator is used in many successful Parabolic trading strategies. Most often, any strategy involves the use of several indicators simultaneously. It is important to always remember that the role of PSAR is to determine the direction of the trend and any changes in it.
Based on this, it is best to combine it with indicators designed to determine the strength of the tendency rather than its direction. You should not use SAR in conjunction with other indicators to determine a trend, as this will only give you two sets of trend-confirming signals. That’s why it’s not that hard to learn how to use Parabolic SAR effectively.
Combine PSAR with an indicator that determines the strength of the trend. You'll find it in all the best Forex robots on the market. Many experienced traders often use the Average Directional Index (ADX). This index measures price movements and provides data that can be used to determine whether a trend is strong or weak. If the trend is strong, you should expect serious changes, and if it is weak, the market will most likely remain flat.
How to combine SAR and ADX? Pay attention to the value of the ADX indicator. If it is lower than 25, the current trend is considered too weak to trade, and the fluctuations will be within a narrow range. The value above 25 indicates that the trend is relatively strong. If the ADX is above 30, the trend is considered strong and now is the time to check the Parabolic SAR.
Strategies for using Parabolic SAR can be adjusted depending on your preferences and working style. Combine it with other indicators, and try different pairs and timeframes. Ultimately, the best results always come with experience.
Conclusion
Forex trading is an exciting activity that can bring you financial independence. However, it also requires in-depth knowledge and comprehension of different techniques and tools. One such tool discussed in this article is PSAR. What is Parabolic SAR? This is a measure that works only in a trend and in no case in a flat. It was invented in the 1970s, and since then, it has been one of the best tools for signaling curve reversals.
It helps traders set stop loss correctly and make more efficient trades. How does Parabolic SAR work with other indicators? It does really well, especially with those that show the power of the trend rather than its direction. Overall, Parabolic SAR is an excellent tool that has been demonstrating its effectiveness for almost half a century.