Every trader wants to catch a graph reversal in time. After all, in this case, they will be able to enter the market at an early stage of a new trend and get maximum profit. Often, for predicting reversals and finding entry points, the concept of divergence is used. This article gives a detailed explanation of what is divergence in Forex trading, how to recognize it, how to use it on charts, and which indicators are the best for this purpose.
What is divergence in Forex?
Divergence is one of the key concepts in the technical analysis. It indicates the discrepancy between the price direction and the direction of the chosen indicator.
At its core, divergence Forex is a reaction to the changing market sentiment. But sometimes it may also result from inertia after remarkable financial events. Divergence is a relatively rare occurrence, but it offers significant advantages to traders who understand how to utilize it effectively.
Some traders believe divergence is an almost 100% signal to open the position. Some people consider it quite risky. In fact, both statements have their grain of truth.
Bullish Divergence
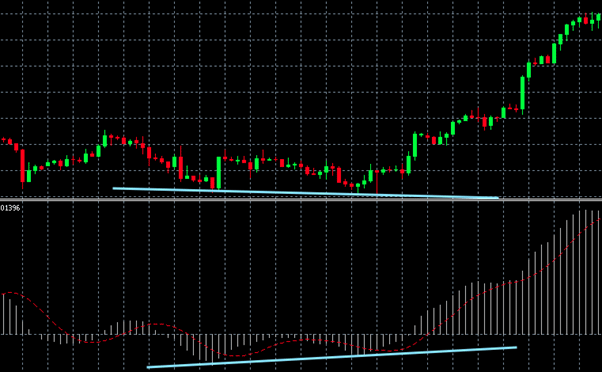
There are two possible directions of price movement in the market — up and down. Accordingly, all traders try to catch a bullish or bearish trend in time. Monitoring Forex divergence can successfully help with this. In each direction, divergence can be regular, hidden, and extended.
To identify regular bullish divergence in Forex, we must look at the lows of the price chart and indicator chart. A typical bullish divergence occurs when the price chart makes a lower second low and the indicator chart makes a higher second low. If the indicator shows divergence, this is a signal of a possible upward movement, which can be used to open a buy position.
Hidden divergence contrasts with a regular type. It indicates the continuation of the trend rather than its turnaround. To identify it, you also need to look at the lows of the price chart and indicator chart. It occurs when the price curve moves up and makes higher lows. In this case, the indicator, displaying divergence, draws a lower minimum.
Extended divergence is the rarest type. With it, indicators have different peaks, and price highs or lows are approximately at the same level (the effect of a double top or double bottom occurs). To identify extended bullish divergence, you need to look at the lows: the price forms a double bottom, and on the indicator chart, the second low will be much higher than the first.
Bearish Divergence

A regular divergence takes place when the price chart makes a higher second high and the indicator makes a lower second high. If the indicator shows divergence, this is a signal for a possible downward movement, which we can use to open a sell position.
Hidden bearish divergence looks like this: the price updates the lower maximum, and the oscillator, on the contrary, tends upward. This situation is also a good reason to open a short position.
To see an extended divergence in a bear market, you should also focus on the highs. With this type, two adjacent price peaks will be approximately at the same level (double top). But the indicator will show a lower second peak.
Types of Divergence Indicators
Many beginners are confused by the abundance of different divergence indicators. However, with all their diversity, they perform the same function — they look for direction discrepancies and notify the trader about them. So, which one to choose? This article will look at the standard indicators available on the MT4 platform. However, there are some custom tools that you may download to your gadget.
What to choose — a classic indicator or a custom solution? Your goals will help answer this question. Classic indicators have been used for many years. They are proven through times algorithms tested by millions of traders. Most often, they are focused on large timeframes (from H4 and higher). At the same time, many custom instruments may be focused on short periods. Below, we will look at the main tools for determining divergence, such as MACD, RSI, stochastic oscillator, and momentum indicator.
MACD (Moving Average Convergence Divergence)
According to many traders, MACD is the best Forex divergence indicator available. Why did such an opinion arise about this particular algorithm? It's quite simple: the tool has performed extremely well over the past 30 years. It was successfully used back in the days when retail trading was not common. MACD accurately signals changes in the market. Even the name of the indicator notes its main function: Moving Average Divergence Convergence.
The indicator uses two moving averages with different periods. This allows you to receive line-crossing signals — a classic notification in trading. However, the indicator itself does not display these lines in the trading terminal but gives the trader information about the distance between them in points. It is represented by a diagram that fluctuates around the zero value in both directions. A rise in the chart above zero indicates a bullish trend, and a fall in the chart tells us that there is a bearish trend in the market.
It is important to note that this indicator owes its high accuracy to rather large periods of moving averages. On the one hand, this slows down the flow of signals, and there are fewer of them. On the other hand, we obtain a more accurate mechanism for identifying divergences. This is why MACD is often referred to as a benchmark divergence indicator.
RSI (Relative Strength Index)
This is a versatile momentum oscillator that has become an essential tool in the Forex trader's arsenal. Developed by J. Wells Wilder Jr., RSI identifies the rate of price movements. It uses the 0 to 100 scale and offers insight into the underlying strengths or weaknesses of currency price trends. This indicator is particularly well suited to identifying overbought or oversold conditions in the divergent Forex market. Divergence is determined according to the standard scheme with the disparity between extremes.
Stochastic Oscillator
The stochastic oscillator is an indicator introduced in the late 1950s. It serves as an important indicator for Forex divergence trading. It works on the premise that closing prices tend to close near the extremes of recent price ranges during an uptrend or downtrend. A stochastic oscillator compares the closing price of a currency pair with its price range over a specified period (usually 14) and produces a value between 0 and 100.
The stochastic oscillator can be called the second most popular indicator for finding turning points. This indicator is distinguished by short periods that are not quite familiar to classical algorithms. On the one hand, this degrades the statistics and quality of signals, to some extent. On the other hand, we get an indicator that is quite responsive to direction changes.
For MT4, it is standard and does not need to be downloaded. Consists of lines that periodically intersect and generate signals. But in the case of divergence, the action plan differs. We consider both lines as one since the gap between them is relatively small. We are interested in the moments when the lines intersect. The highs and lows formed by such intersections can be considered by analogy with how the lows and highs are formed on the MACD indicator.
Momentum Oscillator
This indicator was created by the talented French mathematician Paul Emile Appel, who is the father of many ingenious technical devices and the author of more than a hundred books and articles on analysis, geometry, and mechanics. The indicator readings fluctuate from a central axis, which may or may not be displayed depending on the current indicator settings.
The momentum indicator is a versatile indicator and can be used in several different ways. It can be utilized to confirm the trend confirmation and also show a reversal. A trader's task is to understand the current market sentiment and use the most appropriate indicator signal given the overall context.
Usually, the momentum indicator appears in a box at the bottom of the chart panel. How does it correlate with the divergence definition Forex? If prices make a new high on a chart that is higher than the previous one, and momentum at this time makes a new high on its chart but lower than the previous one, this means that a downward reversal may soon begin. The same principle works for a bullish reversal, but you need to look at the lows of the charts.
Identifying Divergence in Forex Charts

Using a bullish trend as an example, let's look at this situation. After prolonged growth, a decline begins. Usually, it is quite large-scale. Short-term oversold conditions appear in the market and an upward rebound is formed. Buyers become active again, the price updates its maximum. It is not possible to go far, and after that, the market finally turns downwards. Two consecutive peaks appear on the chart.
The considered indicators are useful in that they show such moments. They give a signal in the form of divergence. To see it, just draw straight lines between the highs or between the lows. If divergence occurs, then such lines will diverge. You may also use the best Forex robots. They provide users with comprehensive analytics, including the divergence and dozens of other indicators.
Forex Divergence Trading Strategies
With any Forex divergence strategy, the trader needs to wait for the moment when the pattern is formed. The fact that the chart has moved higher and the indicator value shows a divergence cannot yet be considered our signal. It is necessary to wait for a rollback (the presence of two peaks), and only then we can say with confidence that this is really a divergence. What does this look like in practice? Let's look at it step by step using the example of a bearish trend:
- The market moves down and forms a bottom; after the correction, another bottom appears, and the minimum is updated. At the same time, the oscillator does not show a new low, and we see a divergence.
- The price begins to move up, and the indicator value also increases.
- At the moment when the price crosses the level of the first bottom, we can consider that the divergence signal is confirmed. You can open a buy deal.
The Bottom Line
Divergence is widely used in the Forex currency market to determine a likely trend reversal. Its widespread use is explained by its ease of use and fairly high accuracy. Chart divergence Forex trading becomes easier due to the presence of certain indicators in all trading platforms.
However, you should not believe too much in a single signal. It is important to double-check it at different time intervals, as well as use other technical and fundamental analysis tools. Also, if you are a beginner, it is better to learn to recognize divergence on a demo account, and only after that start risking real money.


