To succeed in Forex, traders should be well-versed in technical analysis tools and graph patterns. The engulfing candlestick pattern gives a prominent signal about market behavior. It is pretty obvious and doesn't allow many interpretations. That's why traders love it and utilize it either separately or in conjunction with other technical tools. This article reveals the concept of engulfing patterns and the ways to integrate them into your strategy. Read on to get a deep comprehension of this must-have tool.
The Engulfing Candlestick Pattern: What It Signals
The engulfing candlestick patterns usually occur at the bottom of the downtrend or the top of the uptrend. Its primary meaning is the turnaround of the trend. Whether you are waiting for the turn of the price curve or earning money while the trend is strong, this pattern will be extremely useful for you.
To recognize engulfing candlesticks, look at the candle sizes. The pattern is formed by two candles, and the second in the row completely covers the first one. In this case, it's usually said that the latter candle "engulfs" the previous one. This only applies to candles’ bodies, not wicks. But if the body of the second candle engulfs the wicks of the candle behind, this shows that the pattern is even stronger.
Types of Engulfing candlesticks
Forex trading is full of dichotomies: uptrend and downtrend, buy and sell, bears and bulls, etc. The candlestick engulfing pattern is not an exception. It works well on any trend direction, though it won’t help much on a flat. Bearish and bullish engulfing patterns have the same principle but show opposite momentums. Let’s dive deeper to understand what is engulfing candle.
Bullish Engulfing Pattern
The bullish engulfing pattern appears at the bottom of the downtrend. The first candle in it is red. It indicates the end of a bear trend. The second candle is green, and it’s bigger than the first one. It opens lower than the previous candle closes, and its top is higher than the previous top. In other words, it fully engulfs the first candle.
This signifies the rise in the number of buyers and a strong upward momentum. From now on, the trend has a high chance of reversing and following the bullish way. This pattern can be observed on any scale, from hourly to monthly, so it can be helpful no matter what engulfing candle strategy you use.
Bearish Engulfing Pattern
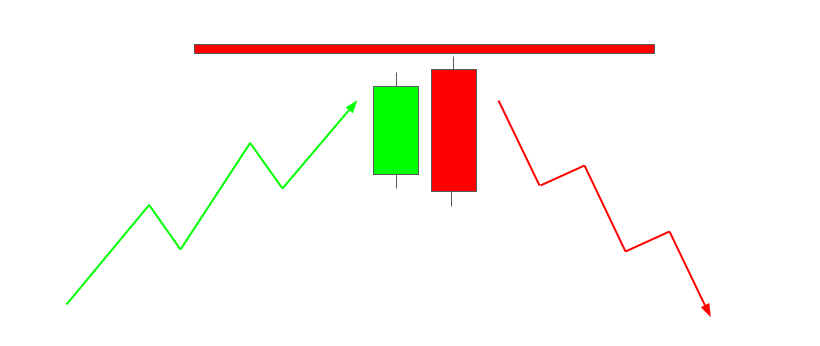
When bulls buy and the trend goes up, the engulfing pattern can also occur. It looks like a mirror reflection of the bullish pattern described above. The green candle will be the first in the row. The second one will engulf its body and, perchance, its wicks. That would mean the reversal of the curve. The signal indicates that, most probably, the curve will turn down.
This happens due to the accumulation of a large number of sellers. Assets start to be sold actively before the turning point, and when the pattern occurs, more people start to sell rapidly, increasing the momentum.
Trading Strategies for the Engulfing Candlestick Pattern
The trading strategy is always built on the idea of price fluctuations. Strong trends usually have bigger earning potential for traders than a flat market. That's why market speculators so eagerly look for reliable trend reversal indicators. They clearly display a point where you can open a position or set a stop-loss order.
The most popular way of using an engulfing pattern is to enter the market on the close level of the second candle. This is the earlier point for entry. If this is a Forex bearish engulfing pattern, you can open a short position, and if it's a bullish one, you will start buying.
The pattern gives an additional tip on how to set a stop-loss. It is usually a level of opening the first candle. The take-profit level is a little more complicated as you set it bearing in mind your targets and risk tolerance.
Although an engulfing candle Forex pattern is supposed to be a trend-reversal signal, it can also be used for trend trading. Thus, bullish patterns can appear on the uptrend and signify the continuation of the curve and its strong momentum. In this scenario, there is a high probability that it's still too early to close the existing position unless other signs appear.
When we observe an engulfing candle pattern, it’s essential to have some confirmation. It can be obtained with numerous oscillators and other tools of technical analysis that indicate further price movement in a new direction. A pattern turns out to be very strong and reliable if it is observed in an overbought (or oversold) area, which can be identified using Bollinger Bands and their analogs.
Pros and Cons of the Engulfing Candlestick Pattern
Now that you know what is engulfing candle pattern and how to use it, it’s time to examine the pattern’s pros and cons. Like any other candlestick pattern, it has its good and bad sides. Let’s start with the first ones:
- The pattern is easily recognized on the price chart. It consists only of two candles, and you can't make a mistake.
- The pattern allows you to clearly determine the price reversal and stop loss level.
- To confirm a reversal, the pattern can be supplemented by appropriate technical analysis tools.
- Attractive risk/reward ratio. This happens due to the small distance between an entry and stop-loss level. The engulfing candle clearly displays these levels.
Now, let’s move to cons:
- Clear signals can only be found in relatively large time frames: from one hour or more.
- False signals may appear on lower timeframes due to market noise.
The task of a trader is not to use any pattern blindly but to be aware of all its advantages and drawbacks and use them wisely for maximum profit. For a better experience and more profitable trading, you may also use the best Forex robots.
The Bottom Line
The engulfing pattern has an important role in Forex trading. When it is formed on the price graph, the market is already subject to noticeable changes. The pattern is quite popular in the graphic depiction of price movements. It’s also very easy to notice it. The appearance of an engulfing line signals a trend turnaround. When the pattern occurs, the preceding trend loses strength as a result of the massive closure of positions. Simultaneously, the upcoming trend is becoming stronger, and positions are opened in the opposite direction. It can be successfully used in conjunction with other technical tools and be helpful both for “reversal” strategies and “on trend” strategies.