Let's start with a definition: what is RSI in Forex? The Relative Strength Index (RSI) is a popular day and intraday trading tool. Let's define what makes this indicator special. In particular, you will learn how does RSI work, how to calculate it, and what traders use it for.
And after reading this article, you will know how to trade using RSI with some strategies. This will allow you to feel free in the Forex market, regardless of whether you use the best Forex robots or trade independently, manually.
What is RSI in Forex?
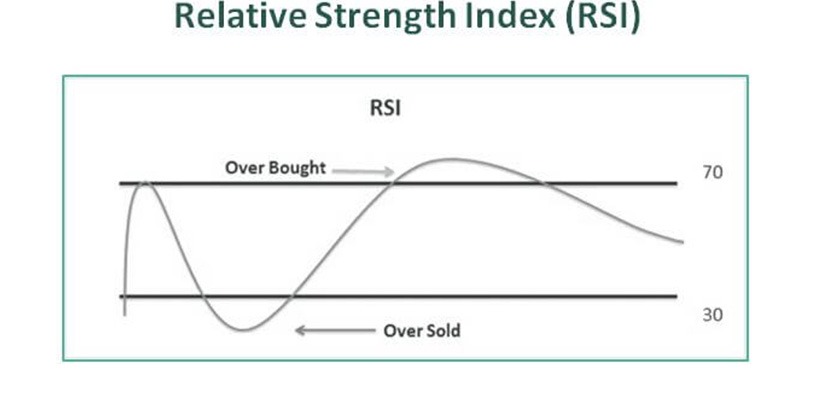
Technical analyst J. Wells Wilder developed the relative strength index. This tool is used to gauge current market strength by Forex traders. In particular, the RSI indicator Forex helps to determine overbought and oversold conditions in the market and is scaled from 0 to 100.
RSI indicator in Forex trading expresses the ratio of up movements to down movements, normalized so that the index is in the range of 0-100. RSI values of 70 or more indicate overbought, while RSI values of 30 or less may indicate oversold.
RSI indicator buy and sell signals
The Forex RSI technical indicator is usually used based on 14 periods and provides three main signals to help traders make trading decisions. It generates buy and sell signals based on two fundamental levels: overbought and oversold. When the RSI indicator is above 70, it is considered overbought and indicates that the security is overvalued, and a price reversal may be imminent. Conversely, when the RSI indicator is below 30, it is considered oversold and indicates that the security is undervalued, and a price reversal may be imminent. These RSI indicator buy and sell signals should not be used in isolation. Use them in conjunction with other technical indicators and fundamental analysis.
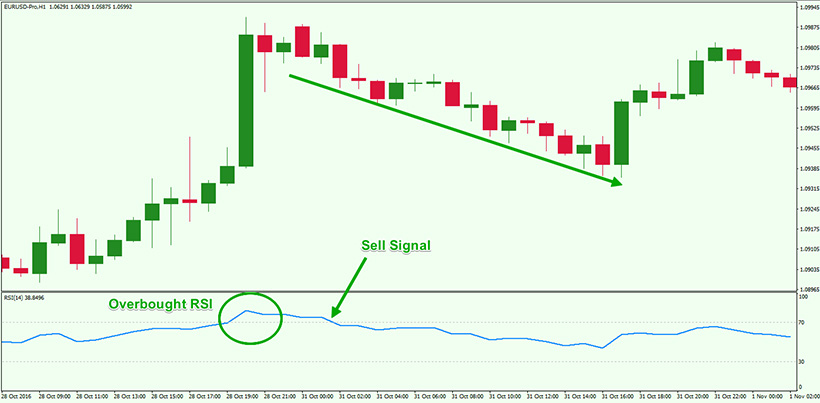
Overbought signal: the relative strength index line entering the 70-100 range indicates an overbought condition.
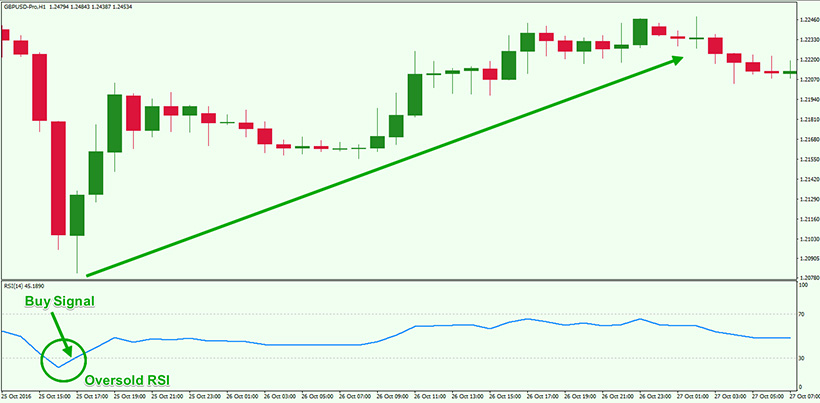
Oversold signal: An RSI line entering the 30-0 region indicates an oversold condition, indicating that the price will likely rise.
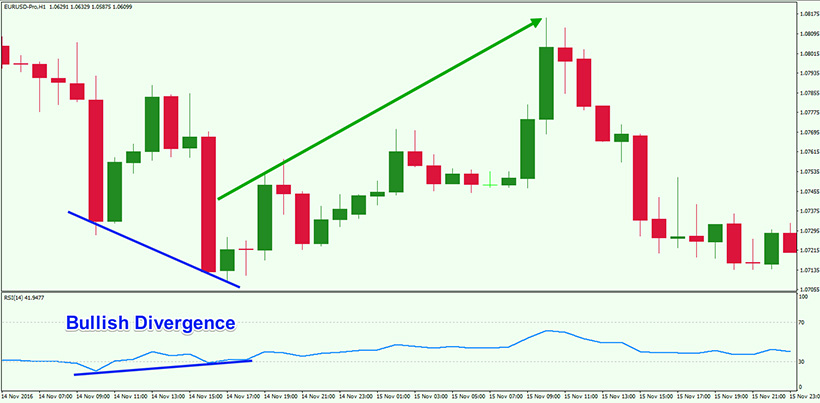
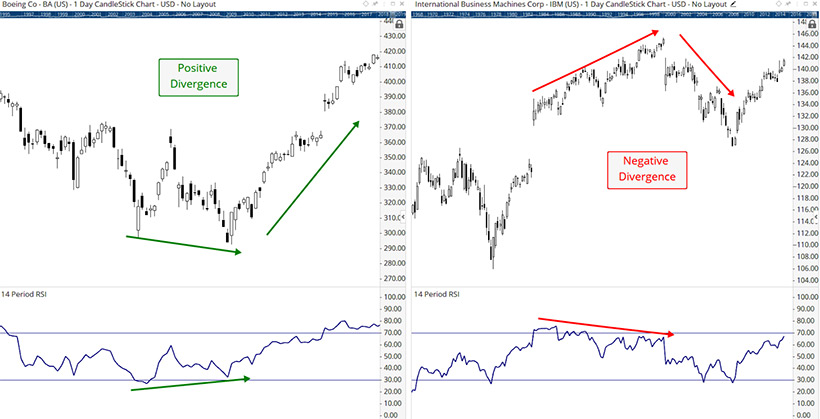
Divergence Signal: An RSI divergence occurs when the price falls, and the RSI line rises, indicating a strong bullish signal. Selling pressure is easing, and a price reversal may be imminent. A bearish RSI divergence occurs when the price rises and the RSI line falls, indicating a strong bearish signal.
Most trading platforms, including the popular MetaTrader 4, have an RSI indicator. To access it, click Insert > Indicators > Oscillators > Relative Strength Index, and the RSI will appear at the bottom of your chart with a default setting of 14 periods.
How to use the RSI indicator in Forex trading?
Since we are talking about an important and popular indicator, it is imperative to understand how to use RSI indicator Forex and correctly identify overbought and oversold market conditions, as well as potential trend reversals.
Therefore, the RSI has two fundamental levels: 70 and 30. A reading above 70 indicates overbought conditions, suggesting the market may be in for a reversal or correction. A value below 30 indicates oversold conditions, which may indicate a buying opportunity.
Using this data, you can determine the trend's strength. An RSI above 50 indicates a bullish trend, while a value below 50 indicates a bearish one. A potential change in trend direction is displayed when you notice the price of a currency pair moving in opposite directions. This picture shows that the upward momentum is slowing, and a potential reversal may be on the horizon.
RSI Line Calculation
Knowing what are the parameters for RSI indicator Forex, you can get early instructions for trading. It is especially effective when you are validating oscillator data with other tools. However, apart from understanding the signals, it is equally essential to determine a good RSI in Forex for your situation. That is why you must learn how to correctly determine the index's value. The calculation formula contains two equations that help. In particular, you should use the average of the “up” and “down” closes over the “N” periods. The RSI value is calculated by indexing to 100.
Therefore, the RSI formula is calculated by subtracting the Relative Strength (RS) value from 100 using a 14-period setting. To calculate the RS, you need to divide the 14 EMA of the last 14 bars up by the 14 EMA of the last 14 bars down. You can adjust the RSI period option as needed, and the formula will change accordingly.
RSI = (100 – (100 / (1 + RS)))
RSI Forex Trading Strategy
Now is the time to learn how to use the oscillator in your RSI Forex strategy effectively. In general, you can choose any of them because there is no single and best Forex strategy. However, you may apply Forex RSI in most of them and use these data to succeed.
RSI OBOS levels
Overbought/Oversold levels are among the RSI indicator's most popular trading strategies. Referred to as the RSI trend line strategy, this strategy aims to predict when the price will bounce off the trend line, creating a trading opportunity.
- If the RSI exceeds 30, the market is oversold, so the price may rise. Once the reversal is confirmed, a buy order can be placed.
- If the RSI is greater than 70, the market is overbought, which is a potential reason for price reduction. You can open a successful sell position when you see and confirm a reversal.
- The RSI 50 level separates bullish and bearish territory, with an RSI above 50 indicating an uptrend and below 50 indicating a downtrend.
However, remember that trading in a strong trend is less profitable and safe than it may seem. In this case, combining several strategies to achieve the desired result, get profit, and minimize potential risks is better.
Two-period RSI divergence
Two-Period Divergence RSI is a technical indicator that uses two RSI periods (usually 5 and 14) to detect a trend change in the market. This indicator allows traders to see when the market is moving away from the general trend, which may indicate a possible change in price direction.
So, in this case, you will have to use the short 5-period RSI over the longer 14-period RSI and watch for crossovers. The short RSI is more responsive to recent price movements, so it can show early signs of a reversal. A buy signal is generated when RSI 5 crosses RSI 14, and a sell signal is generated when RSI 5 crosses below RSI 14. It combines well with the Pivot Points strategy, leading the trader to awe-inspiring results.
RSI trend lines
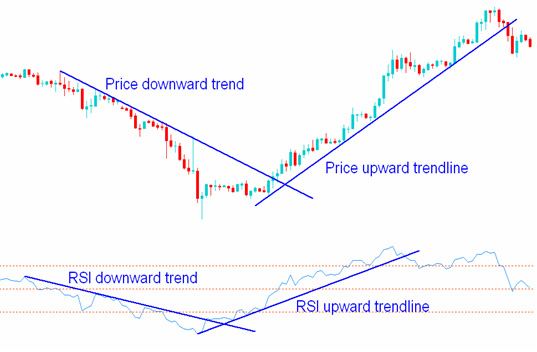
A breakout of the RSI trend line may indicate a possible change in the direction of the price trend. You need to connect highs and lows to form a trend line on a chart. To do this, connect three or more points on the RSI line. Thus, you will get an ascending (bullish) or descending (bearish) trend line.
If the price crosses the upward trend line, it can be a signal to buy. If the price crosses the downward trend line, it may be a signal to enter a sell deal. Remember that the break of the RSI trend line usually precedes the break of the price trend line, so you have enough time to identify possible opportunities in the market.
Classic RSI divergence
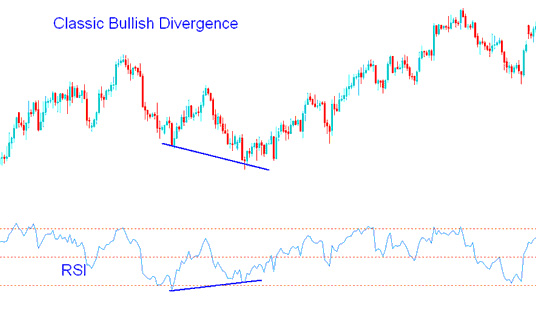
A bearish RSI divergence is formed when the price forms a higher high, and at the same time, the RSI declines to form a lower high. This reversal pattern usually occurs at the top of a bull market. Instead, a bullish RSI divergence will form when the price makes a lower low, and the RSI forms a higher low. Such a signal tells you that the direction of the trend may change and go up.
The Bottom Line
So, now, you have the Forex RSI indicator explained, and you can also read the Money Management on Forex tips. All of this together will give you a great foundation for making successful trading decisions, ignoring false signals, and always keeping the market context in mind. Remember that not only in Forex but also in other markets, there is no universal indicator. Otherwise, all traders would use only one, and the matter would be as simple as possible. However, it will take effort and mastering the different options before you find your unique toolkit for making great profits.