Accumulation/Distribution Indicator (A/D): A Trader’s Guide

Accumulation/Distribution Indicator (abbreviated as A/D) is one of many technical indicators designed to analyze price movements and trading volumes simultaneously. Since these data are interconnected, A/D helps understand how volumes affect prices. To work with this tool effectively, you first need to understand what accumulation and distribution in Forex are and how to interpret them correctly.

What Is the Accumulation/Distribution Indicator?

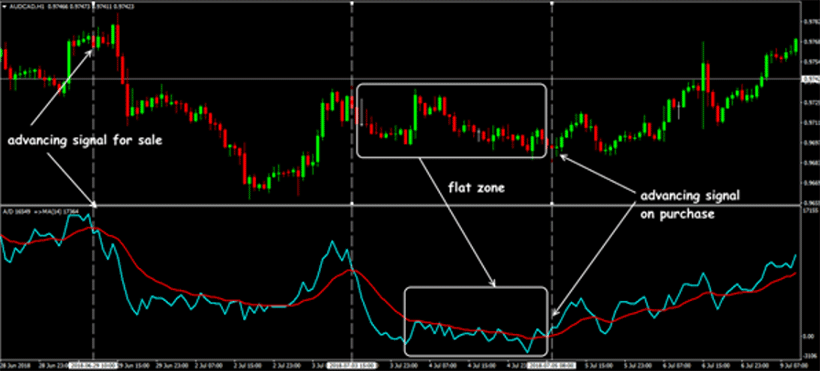
Accumulation/Distribution Indicator (A/D): A Trader’s Guide - img 01

Let’s take a closer look at what is accumulation and distribution in Forex. A/D helps measure the strength of investments in a particular asset. Depending on the price and trading volume, you can determine whether large players are buying and accumulating the asset or selling it, causing its distribution across the market. The strength of a trend can also be identified using accumulation and distribution in Forex. Traders once again look at the trading volume and compare it with the rise or fall in price. If the price is rising along with volume, it indicates a strong upward trend. If both volume and prices are falling, the trend is weak or downward.

How the Accumulation/Distribution (A/D) Indicator Works?

Now, let’s look at what is accumulation distribution indicator and how to use accumulation distribution indicator to identify the data you're interested in. The accumulation distribution line allows you to see trading volume and price movements up or down on the timeframe. When volume and price movement align, it indicates that large players are actively buying. When the price sharply drops, it means large players are offloading the asset by selling it. This way, you can observe the trend and market sentiment (bullish or bearish) and accordingly make decisions about when to enter or exit trades. Everything depends on the individual situation, so there is no single correct answer. You can follow the trend and buy or sell accordingly, or go against the trend if other indicators suggest a potential reversal.

Accumulation Distribution (A/D) Indicator Formula and Calculation

To accurately calculate the accumulation/distribution indicator, the following formula is used:

Accumulation/Distribution Indicator (A/D) formula

How to identify accumulation and distribution using this formula? A/D is the value you see in your timeframe. In this equation, Close represents the closing price. High and Low are the maximum and minimum prices within the selected timeframe, respectively. Volume in the formula refers to the trading volume.

Interpretation of the Accumulation Distribution (A/D) Indicator

How to use the accumulation distribution indicator in your case? To do this, you need to interpret the signals of this tool correctly. Here’s how it's done:

  • An increase in the accumulation/distribution line indicates asset accumulation and confirms an uptrend. For a trader, this could mean that the asset’s price will continue to rise. If the trader has already opened a position and is waiting for the optimal time to close it, they might want to wait longer to secure a higher profit.
  • A decrease in the accumulation/distribution line on the timeframe, in contrast, indicates trend weakness and a downward movement. It may also suggest a potential downward reversal.
  • If the accumulation distribution indicator Forex shows a divergence with the price movement (the price rises, but the A/D indicator moves down), this can be interpreted as a loss of trend momentum. That is, the price is moving without the support of trading volume. Each of these situations can be leveraged to your advantage, depending on whether you are already holding a position or planning to open or close positions.

How to Use the Accumulation/Distribution Indicator in Trading

Use the accumulation distribution cycle to:

  • Confirm the current trend. You can assess its strength and momentum to ensure the safety of entering positions.
  • Identify divergences. By spotting discrepancies between price and volume, you can identify moments when the trend may reverse.
  • Confirm breakouts. Support and resistance lines are usually used to determine this, but the accumulation and distribution in Forex can help confirm the validity of the breakout and support or refute your assumptions and forecasts made using other indicators.

Accumulation/Distribution Indicator (A/D) vs. On-balance Volume (OBV)

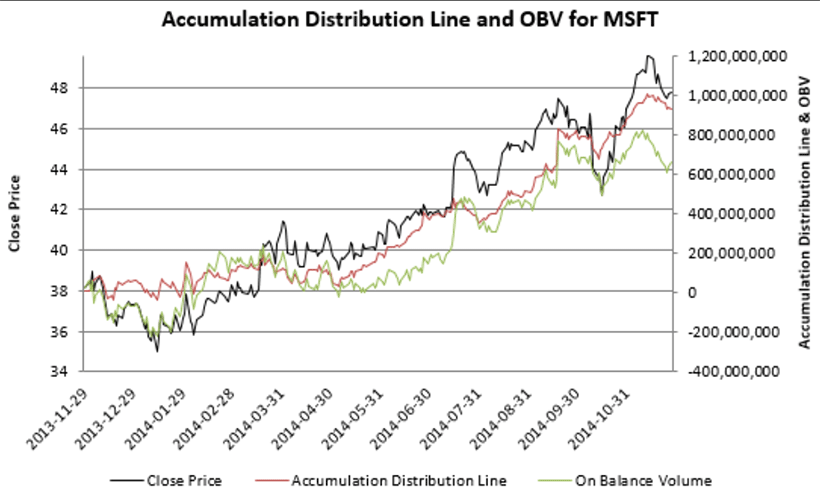
Accumulation/Distribution Indicator (A/D): A Trader’s Guide - img 02

Given that the Accumulation/Distribution Indicator is very similar to the On-balance Volume (OBV) indicator, beginners may confuse them. This is not surprising, as both aim to measure trading volume. However, there are still differences between these tools.

  • The A/D indicator takes into account the price highs and lows (high-low) within a user-selected time frame. OBV, on the other hand, exclusively shows the rise or fall of volume.
  • The A/D formula allows for more factors to be considered simultaneously, making the results more accurate. The accumulation and distribution phase is particularly important to monitor when determining short-term market trends, where signal accuracy is critical for decision-making.

Nevertheless, A/D can be used alongside On-balance Volume to confirm or invalidate a forecast. However, traders often lean towards using the A/D measurement with additional indicators, such as those focused on price action or market sentiment tools like the fear and greed index. For more details on how to properly use OBV, refer to our article On-balance Volume (OBV) Indicator: A Comprehensive Guide.

Integration with Other Indicators

Whether trading manually or using the best Forex robots, the A/D indicator is not the sole signal that determines a trader’s decisions. The signals from one tool are always confirmed by another. A/D works best in combination with:

  • Moving Averages, which help filter out false signals and provide a clear view of the trend’s strength and direction.
  • Bollinger Bands, which complement A/D excellently. When the A/D line shows weakness in the trend and the price line approaches the outer Bollinger Bands, it's time to exit positions, as the trend is weakening.
  • RSI, another great tool that pairs well with the signals from the A/D indicator. RSI focuses on tracking price changes, reinforcing the results you see from A/D, or revealing divergences, which can also indicate trend weakness.

Accumulation Distribution (A/D) Indicator Trading Strategies

The best approach to trading with the adma indicator is trend trading. For example, if the price is rising but the A/D line is still declining, you might observe that a trend reversal is imminent, and it's the right time to sell before the rest of the market follows. This can also be called a divergence strategy. A/D helps filter out false signals effectively, allowing traders to avoid market traps.

Another successful ADL indicator strategy is breakout trading. When the price breaks through support or resistance levels and A/D confirms this, traders can open buy or sell positions depending on the situation.

Advantages and Limitations of Accumulation/Distribution Indicator (A/D)

The accumulation and distribution Forex indicator offers many benefits: signal accuracy, the ability to filter out false signals, and excellent compatibility with many other indicators. The only drawback of the accumulation/distribution forex indicator is its reduced accuracy in low-liquidity markets. In such cases, it’s crucial to confirm signals using additional tools.

A/D Indicator: Practical Tips for Forex Traders

Here are some more tips to improve efficiency and mitigate risks that could cost money:

  • Use the Forex accumulation distribution in conjunction with other tools.
  • Rely on other indicators when dealing with low-liquidity assets.
  • Check data across multiple time frames to get a comprehensive view of the market.

The Bottom Line

Make Forex accumulation distribution your assistant in determining market sentiment and assessing trend momentum. Supplement it with a few other tools, and you’ll be able to make well-informed and profitable decisions regarding your assets.