The simplest tool that displays price movement is a moving average. Depending on the selected period, it can be smoother or more volatile. MA is, in fact, a representation of the average price for a certain time frame. Traders often use MA(20), MA(99), and more to understand the trend in general.
Based on these simple curves, many other indicators and technical analysis tools were invented. Two such tools are the Golden Cross and Death Cross. These patterns are intersections of two MA’s and can provide useful additional information for traders. In this article, we will consider how to identify them and use them in your trading strategy.
What Is the Golden Cross?
To find the Golden Cross Forex pattern, short-term and long-term moving averages are used. Most often, these are MA(50) and MA(200). The first one denotes the average price for 50 days, and the second one — for 200 days. The golden cross is considered a bullish signal and is formed by the intersection of short-term and long-term moving averages. In more detail, this process can be divided into three stages:
- MA(50) is below MA(200). This period is characterized by a downward trend.
- The short-term moving average approaches the long-term one and crosses it. The intersection point can be considered an approximate reversal point.
- MA(50) moves up and is above MA(200). This is the beginning of a bullish trend.
The principle of the golden cross is simple: if the short-term moving average is lower than the long-term one, the price changes more slowly over a shorter period, and the trend is bearish. However, as soon as MA(50) rises, changes occur in the market, and a trend for price growth appears. At this point, the golden cross can be seen on the chart.
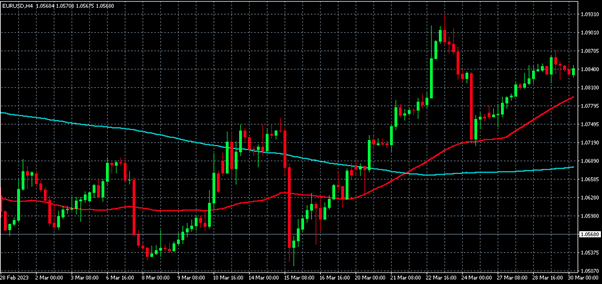
The figure below shows the EUR/USD currency pair chart on the H4 timeframe. The short-term moving average is shown in red, and the long-term one is shown in blue. It is seen that in the first two-thirds of the chart, the price fluctuations are insignificant and roughly correspond to the concept of "flat." However, after the intersection of MA(50) and MA(200), the price chart begins to move rapidly upward.
What is the Death Cross?
The Death Cross Forex is also formed from two moving averages. However, here, their directions are opposite to what we observed on the golden cross chart. The short-term moving average crosses the long-term one from top to bottom. This is considered a bearish signal. Three stages can also be distinguished in the formation of the death cross:
- Before the intersection. The short-term MA is above the long-term MA. At this time, the market usually sees an upward trend.
- The moving averages intersect, and the trend changes.
- The short-term MA drops below the long-term one. At this time, a downward trend is formed.
The 50-day and 200-day moving averages are also most often used to construct this pattern. However, other time frames can be used if desired. The death cross has such a name because it symbolizes a market decline and a massive sale of assets.
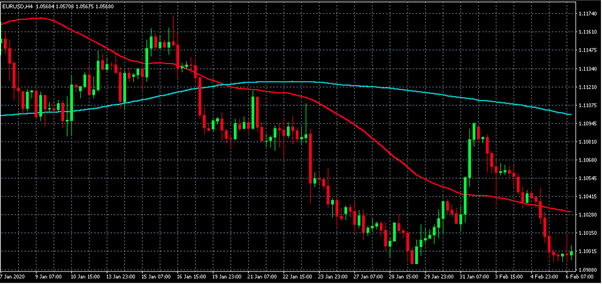
The image below shows another fragment of the EUR/USD chart. The blue MA(200) crosses the short-term red MA(50) from bottom to top. The price remains flat for some time and then falls. Despite a small price peak on the right side of the chart, the fall continued further. So, in this example, the Death Cross gave an accurate forecast.
Key Differences Between Golden Cross and Death Cross
The golden cross vs death cross patterns are simple in drawing and interpretation. The first one is a bullish signal, and the second one is a bearish signal. For simplicity, let's present the main differences between the patterns in a table.
| Golden Cross | Death Cross |
|---|---|
| Signal for a long position | Signal for a short position |
| Short-term moving average crosses long-term from bottom to top | Short-term moving average crosses long-term from top to bottom |
| There is a downward trend before the golden cross | An upward trend is observed before the death cross |
The reliability of these patterns increases with scale. This is why moving averages with such large periods are used. Due to the large trading volume, the Golden Cross and Death Cross can be considered quite reliable indicators.
How to Use Golden Cross and Death Cross Patterns on Forex
Like any other technical indicator, the Death Cross vs Golden Cross pair can be included in your trading strategy in different ways. Although the signals are quite unambiguous, the approaches of different traders may differ in detail.
Here are practical tips to help you use the pattern more effectively. However, remember that they are not an action guide but only possible options:
- Wait for a new trend to emerge after the cross appears on the chart. Then open a position.
- Use the cross together with other indicators or to confirm other indicators.
- One time frame may show a golden cross, and another — a death cross. Look at the chart on different scales.
- Use volume indicators to confirm the signal. A volume change can accompany a change in trend.
- Popular tools that work well with crosses are MACD and RSI.
- Remember that moving averages are lagging indicators, so crosses are not a forecast but a confirmation of a new trend.
It is also important to remember that any indicator works differently in different strategies. For example, in scalping, the Golden Cross and Death Cross will not be effective. Use your observations and adapt the tools to your strategy.
The Bottom Line
Today, traders know dozens of major and hundreds of minor technical analysis tools. All of them have varying degrees of complexity and reliability. This article reviewed simple and fairly reliable patterns: the Golden Cross and the Death Cross. They are intersections of two moving averages and give clear signals to buy or sell.
Crosses allow you to more accurately determine the trend reversal point and open a position in time. It is also important to note that with an excess of technical information, you can delegate the analysis of moving averages, crosses, numerous oscillators, and indicators to electronic assistants. For example, the best Forex robots analyze a huge amount of data to help traders make accurate decisions. However, despite any smart tools, an experienced trader should know what is Death Cross and Golden Cross.

