The search for easy-to-interpret signals for successful Forex trading will lead you to the Awesome Oscillator indicator. This is one of the most popular technical analysis pillars, proposed by the famous American trader Bill M. Williams. It allows traders to determine the mood that currently dominates the Forex market. An Awesome Oscillator helps anticipate reversals and confirm signals obtained with other technical analysis indicators. Due to its wide application, you may find it useful to familiarize yourself with the possibilities of using it in developing trading strategies.
What Is the Awesome Oscillator?
To understand the meaning of the Bill Williams Awesome Oscillator, you need to take a closer look at the trading philosophy of this talented trader. Bill M. Williams was the author of books on trading and chaos theory. He was convinced that the advantage in trading would be gained by those who understand trading as a chaotic process. Therefore, predicting the future state of the market, according to the author, is meaningless. It is much more important to focus on current trends and emerging trend patterns. To achieve success in this, Bill M. Williams developed several indicators that are extremely popular in various markets, including Forex.
So what is the Awesome Oscillator (AO)? This is one of the momentum indicators that allows a trader to discover the following information:
- Trend strength;
- Trend direction;
- Potential for its development.
Thus, the AO indicator contains comprehensive information that will be extremely useful when deciding to open trading positions on Forex.
How Does the Awesome Oscillator Work?
The Awesome Oscillator is the same type of indicator as the MACD (Moving Average Convergence/Divergence) proposed by Gerald Appel. The debate about Awesome Oscillator vs MACD is a thing of the past because traders successfully use both approaches to analyze trends. Both indicators evaluate the dynamics of the price movement but do it a little bit differently:
- The MACD uses the closing prices and 12, 26, and 9-day periods for comparison.
- The Awesome Oscillator is based on the median prices and 5/34 period SMA (Simple Moving Average) for comparison.
How to read the Awesome Oscillator in this context? It measures the last 5 bars in terms of their momentum and compares it to the same measure for the last 34 bars:
- 34 bars represent the long-term trend.
- 5 bars show the current market sentiment.
What does the Awesome Oscillator measure? By comparing these slow (34) and fast (5) SMAs you can see whether the prevailing trend will continue in the near future or whether a reversal is likely to occur.
Awesome Oscillator Formula
One of the important advantages of this indicator is that the Awesome Oscillator formula is simple. Its meaning is clear, and therefore, the trader does not have any questions about how this value was obtained.
Since the AO indicator uses a median price, you need to calculate it using the following formula:
Median price = (highest price + lowest price for the selected timeframe)/2
Once you have two values for 34 and 5 bars, you can proceed to calculate the indicator:
AO indicator = SMA (median price for 5 bars) - SMA (median price for 34 bars)
How to Use an Awesome Oscillator in Trading
To determine the nature of the market, a trader needs to know how to use Awesome Oscillator. This indicator allows you to discover information that remains in the shadows without comparison with long-term trends. To start working with this indicator, you need to look at the histogram with the AO indicator values. It consists of the following elements:
- Central horizontal zero line;
- Positive AO Zone: green and red bars of different heights above the zero line;
- Negative AO Zone: green and red bars below the zero line.
If the fast SMA is above the slow SMA, the histogram bars are located above the zero line. If vice versa, the bars will be in the negative AO zone. The higher the bars, the stronger the trend and the higher the divergence between the SMAs.
A bullish market can be determined by the AO indicator being above the zero line, and a bearish market ‒ by being below the zero line. But remember that the momentum can shift in the opposite direction. If you use the best Forex robots, they will very accurately interpret the information hidden in the Awesome Oscillator. In this case, decisions made on the basis of its analysis will be effective and timely.
Key Signals and Trading Strategies Using the Awesome Oscillator
Now, you know what the AO indicator measures are and can move on to using an Awesome Oscillator strategy.
Zero Line Crossover
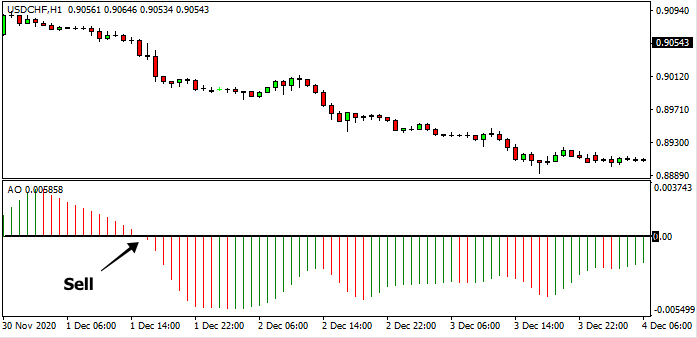
As long as AO remains above or below the zero line, the trend continues. However, crossing it means a shift in the market momentum. Therefore, a trader can take this into account when placing orders:
- A Zero Line crossover up gives a Buy Signal.
- A Zero Line crossover down gives a Sell Signal.
Twin Peaks
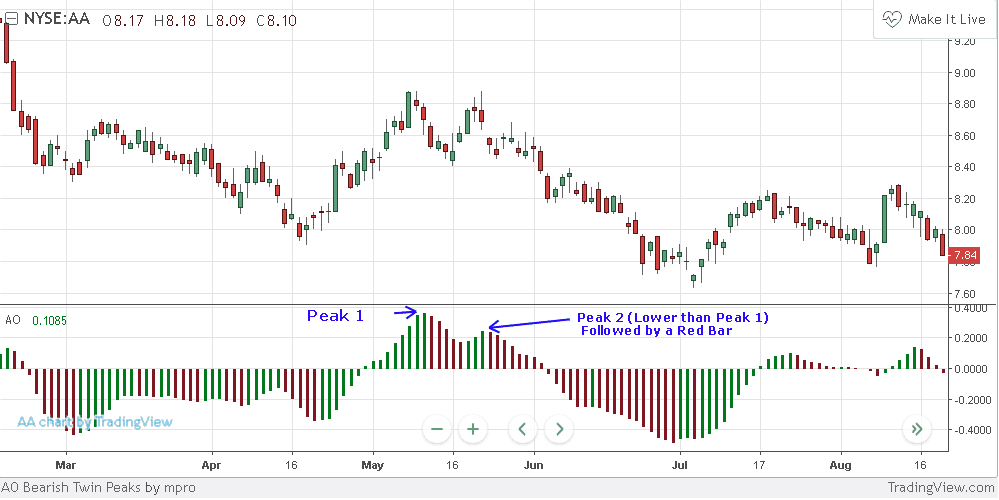
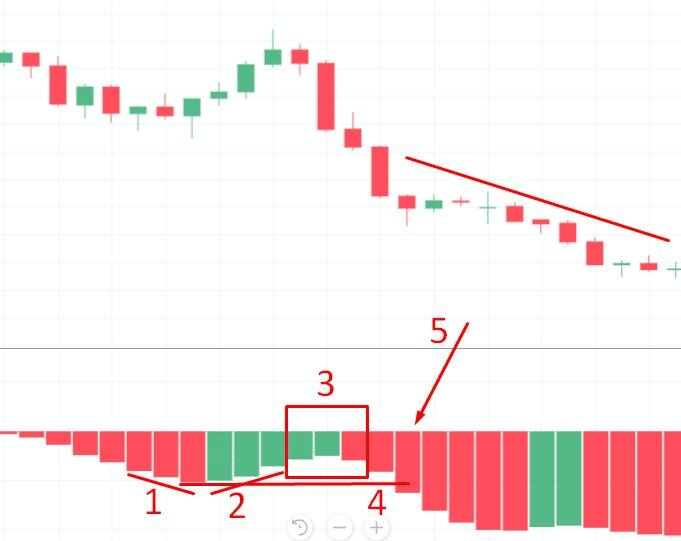
This model allows you to see a signal for a trend reversal before crossing the zero line. It indicates a weakening of the previous trend due to its exhaustion. Twin Peaks are similar to the Awesome Oscillator divergence, which also determines possible reversals in price trends. Visually, this model looks like two peaks and a trough, which can be situated in the positive or negative zone.
- Twin Peaks in the positive zone give a Sell Signal since the bullish trend has exhausted itself.
- Twin Peaks in the negative zone give a Buy Signal since this is a sign of an emerging bullish trend.
Saucer Signal
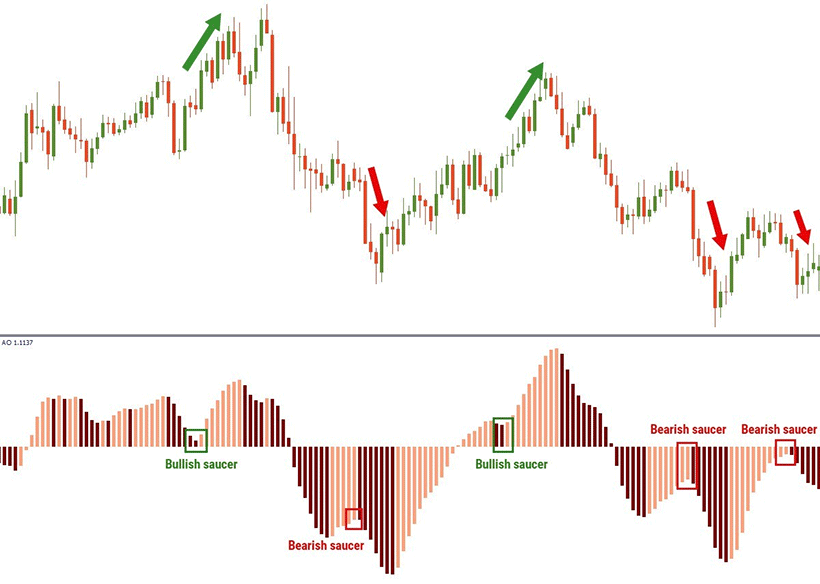
This signal indicates a gradual transformation of the trend. The pattern consists of three bars: the first two of the same color, and the third one is different from them.
- Sell Signal: the first two bars are green, and the third one is red and lower than the previous one. The pattern is located below the zero line.
- Buy Signal: the first two bars are red, and the third one is green and higher than the previous one. The pattern is located above the zero line.
Both orders are placed when the fourth bar is opening.
How to Use Awesome Oscillator
The Awesome Oscillator secret is that a trader can use it in different ways since it contains complex information. It can indicate a gradually growing trend and the accumulated potential for a quick trend reversal. But relying only on the AO indicator for making decisions can be risky. That is why traders usually use it in combination with other signals.
Combining AO with Other Indicators
What is Awesome Oscillator value in complex analysis of current market trends? It can serve as a primary insight that you will verify with other signals. Or you can use it as a confirming signal for other methods of technical analysis. Most often, it is used in the following combinations:
- Awesome Oscillator + Accelerator Oscillator + Parabolic SAR
- Awesome Oscillator + Accelerator Oscillator + Stochastic Accelerator
- Awesome Oscillator + EMA
Common Mistakes to Avoid When Using the Awesome Oscillator
- You shouldn't use the AO indicator as your main signal. Since in this case, the probability of a correct signal may be less than 50%.
- Market noise can distort the Awesome Oscillator. Therefore, using it on the news may give false signals.
- The Awesome Oscillator works best for medium-term traders, but it is not recommended for scalpers.
- Don't rush to use the AO indicator in real trading as soon as you hear about it. First, conduct demo tests and backtests to see how it fits into your trading strategy.
Advantages and Limitations of the Awesome Oscillator
The obvious benefits of using the AO indicator have placed it among the most popular technical analysis tools. Here are just a few of them that can improve your trading:
- The Awesome Oscillator explained makes it a universal indicator for any market, including Forex, stock market, cryptocurrency market, etc.
- The logic and formula of the Awesome Oscillator are clear to any trader, even those who are just entering the Forex market. AO-based patterns are also easy to spot, which makes them convenient for analysis.
- Awesome Oscillator indicator gives good results in combination with other signals. Therefore, traders often resort to it to confirm insights obtained from other indicators.
There are also limitations to using the AO indicator that should be taken into account:
- The indicator works well on large timeframes, but on small ones, it produces many false signals.
- It captures strong trends better than weak ones, so be prepared for false signals during flats.
- The Awesome Oscillator calculation formula does not take trading volumes into account.
Conclusion
What is Awesome Oscillator indicator in Forex trading? This is a good tool for determining market impulses. With its help, you will understand when the previous trend has exhausted itself and the market has approached a reversal. You will also be able to determine the continuation of the trend or its soft transformation.
The AO indicator is part of the basic set of technical analysis tools that most traders use. But few rely on it primarily, since it has certain limitations. More often, AO is used in combination with other indicators, which provides additional reliability to the signal and leads to trading success.