Il successo di un trader dipende da molti fattori. Uno di essi è un'analisi qualitativa dei grafici che descrivono la situazione di mercato attuale e che consentono di costruire la previsione più accurata del comportamento dell'attività in futuro. Uno degli indicatori più comuni è il Candlestick dell'Uomo Appeso. Può essere considerato una sorta di segnale di avvertimento che indica possibili cambiamenti di mercato. Ecco perché un trader di successo dovrebbe notare tale candeliere in tempo e analizzarlo correttamente. Approfondiamo cosa significa la formazione del modello Hanging Man Pattern nel contesto dell'azione dei prezzi e della psicologia di mercato.
Cosa è un Candlestick dell'Uomo Appeso?
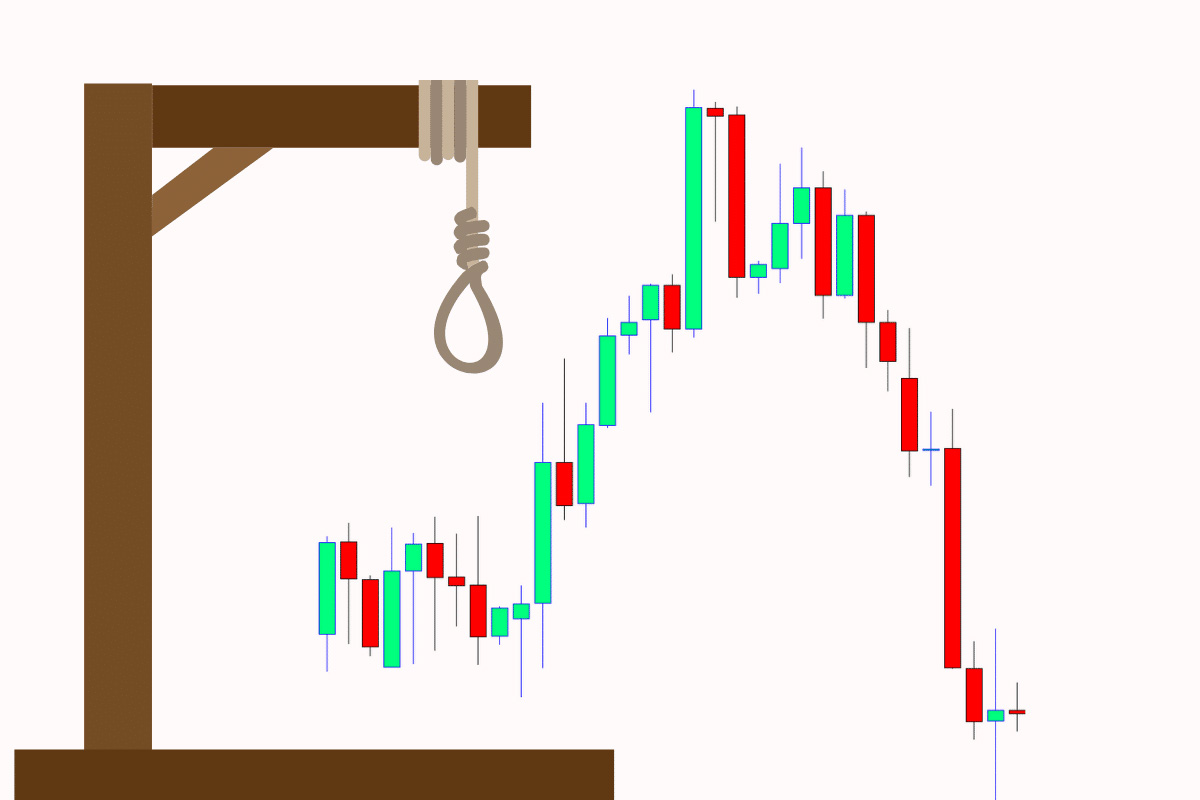
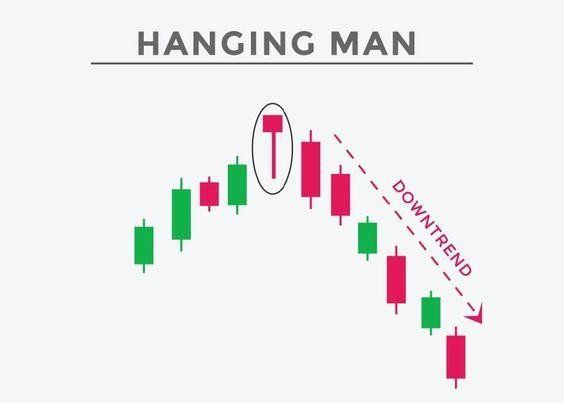
Il Candlestick dell'Uomo Appeso può essere considerato una formazione critica del grafico. Questo modello indica più comunemente un'inversione potenziale che si verifica in un trend al rialzo. Il grafico ha preso questo nome perché assomigliava a un uomo appeso. Può essere identificato dalle seguenti caratteristiche:
- Un piccolo corpo nella parte superiore dell'intervallo;
- Una lunga ombra nella parte inferiore.
Se un trader opera sui mercati azionari o valutari volatili, conoscere solo i migliori coppie di Forex su cui fare trading non è sufficiente. Il riconoscimento precoce del Candlestick dell'Uomo Appeso è vitale, poiché può indicare futuri significativi ribassi e l'instabilità della situazione positiva attuale.
Anatomia del Candlestick dell'Uomo Appeso
Per analizzare meglio l'anatomia del Candlestick dell'Uomo Appeso nel Forex, è cruciale capire come appare questo grafico. Si verifica durante un trend al rialzo quando i tori stanno iniziando a perdere il controllo del mercato. Il modello si forma quando i prezzi di apertura e chiusura sono vicini al limite superiore dell'intervallo di negoziazione. Per far salire di nuovo il prezzo alla chiusura, si verifica una vendita abbastanza consistente durante la sessione di trading. È così che il modello del grafico dell'Uomo Appeso riflette un cambiamento negli impulsi. Questo indica che il trend attuale potrebbe esaurirsi piuttosto rapidamente.
Il modello di candeliere Hanging Man ha i seguenti componenti.
- Il corpo effettivo. Di solito è piccolo, mostrando una leggera differenza tra i prezzi all'apertura e alla chiusura del mercato. Questa parte del grafico indica una certa indecisione tra venditori e acquirenti.
- L'ombra superiore. Il suo dimensione è piccola. Ciò indica che il prezzo non si sposta molto dal livello all'apertura o alla chiusura della sessione di trading.
- L'ombra inferiore. Il candeliere Hanging Man ha un'ombra inferiore piuttosto lunga. È la caratteristica principale di questo modello. L'ombra dovrebbe essere almeno due volte più lunga del corpo effettivo del grafico.
Il Colore del Candeliere Hanging Man è Significativo?
Il colore di questo modello può influenzarne l'interpretazione. Spesso, i grafici sono rossi e verdi. Il colore indica a quale trend il modello appartiene. Il verde segnala che il prezzo dell'attivo era più alto alla chiusura rispetto all'apertura del trading. Il grafico rosso descrive la situazione opposta: il prezzo di chiusura è inferiore rispetto all'apertura. Questo segnale è leggermente più forte rispetto a quello descritto in precedenza e indica l'avvicinarsi di un trend al ribasso.
Implicazioni del Hanging Man per il Sentimento di Mercato
Il candeliere Hanging Man ci dice come il sentimento di mercato passa da abbastanza positivo a ribassista o semplicemente cauto. La fiducia tra gli acquirenti inizia a indebolirsi e i venditori vedono un'opportunità di ritirarsi. Il modello Hanged Man parla dell'equilibrio di potere nel mercato, che può cambiare rapidamente.
Vale la pena ricordare che, come tutti gli indicatori di trading, questo modello non è infallibile. Il prezzo di un attivo può essere drasticamente influenzato da vari fattori, ovvero:
- Notizie;
- Cambiamenti geopolitici ed economici globali;
- Condizioni di mercato, ecc.
Questo può sovrapporsi ai segnali di trading che un investitore riceve analizzando l'Uomo Appeso e altri pattern di candele.
Caratteristiche chiave dei pattern dell'Uomo Appeso
Questo pattern indica una possibile inversione di tendenza nonostante una posizione alquanto forte al rialzo. Non appena un trader nota la Candela dell'Uomo Appeso, dovrebbe iniziare a prepararsi ai cambiamenti nella strategia di trading, poiché questo grafico è noto per le sue implicazioni ribassiste. In questo caso, il grafico può avere diverse varianti, che è importante conoscere. Ad esempio, nonostante la stessa struttura di base, l'Uomo Appeso rialzista e ribassista hanno interpretazioni diverse, specialmente considerando l'azione dei prezzi successiva.
Le Candele dell'Uomo Appeso e del Martello: Differenze chiave
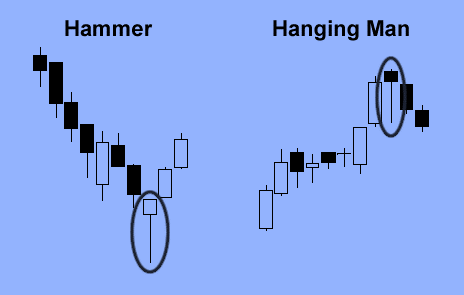
La candela del martello è un analogo rialzista del pattern dell'Uomo Appeso. Descrive una situazione sul mercato in cui il prezzo inizia a salire dopo la pressione degli acquirenti, il che significa che gli orsi hanno perso il controllo su di esso. Pertanto, il pattern del Martello, che di solito consiste in una singola candela, indica possibili inversioni rialziste che possono verificarsi dopo un trend al ribasso. Di conseguenza, il grafico ha un piccolo corpo e una lunga ombra inferiore.
La capacità di analizzare il pattern della Candela del Martello completa la conoscenza di un trader del Pattern Forex dell'Uomo Appeso. Fornisce una visione più completa delle inversioni di mercato. Tuttavia, prima di prendere qualsiasi azione, un trader dovrebbe attendere la conferma del modello in questione. Potrebbe trattarsi dell'arrivo di altri indicatori che possono essere ottenuti dai migliori robot Forex.
Se il modello Hammer è provato, un investitore può aprire una posizione lunga. Prima di farlo, vale la pena prestare attenzione alla forma e alle dimensioni della candela. Se la candela è abbastanza grande e ha un ampio corpo inferiore, potrebbe segnalare una forte pressione da parte degli acquirenti.
Comprendere la differenza tra il Candlestick dell'Uomo Appeso e il Martello è vitale per un trader. Tuttavia, è piuttosto difficile notare queste differenze perché entrambi i grafici hanno un corpo piccolo e un'ombra inferiore lunga. I loro significati sono distinti in varie condizioni di mercato. "Martello" indica una possibile inversione rialzista e appare durante un trend al ribasso, mentre "Uomo Appeso" segnala una possibile inversione ribassista e appare durante un trend al rialzo.
Uomo Appeso e Altri Pattern Candlestick
I trader usano spesso il Candlestick dell'Uomo Appeso. È abbastanza efficace nei mercati finanziari. Tuttavia, l'accuratezza di questo modello può variare. Il pattern sarà più affidabile se confermato da un successivo prezzo ribassista e da altri indicatori tecnici e modelli di trading.
In totale ci sono 35 pattern candlestick. Tra questi, i trader usano più spesso sette principali:
- Stella del Mattino
- Martello
- Martello Invertito
- Modello di Perforazione
- Stella Cadente
- Doji
- Appeso
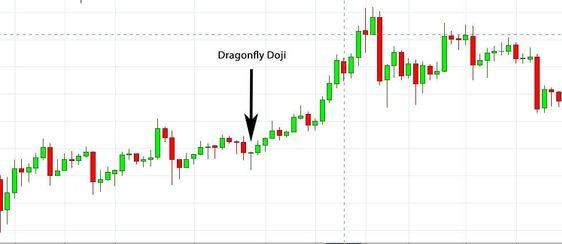
Doji Libellula
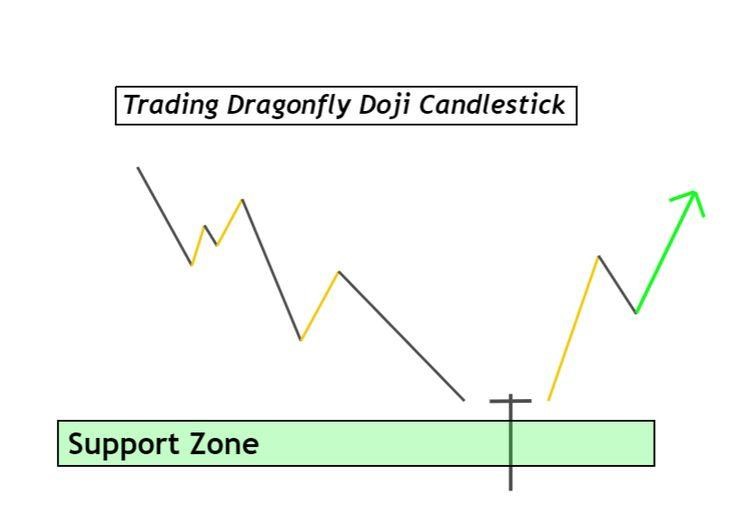
Il pattern Doji Libellula si verifica quando il prezzo di un asset non è troppo diverso all'inizio e alla fine del trading. In questo caso, i numeri possono essere uguali o molto vicini. Ciò indica che orsi e tori sono in equilibrio, il che significa che la forza di uno dei due lati del mercato non è ancora stata determinata.
Stella Cadente
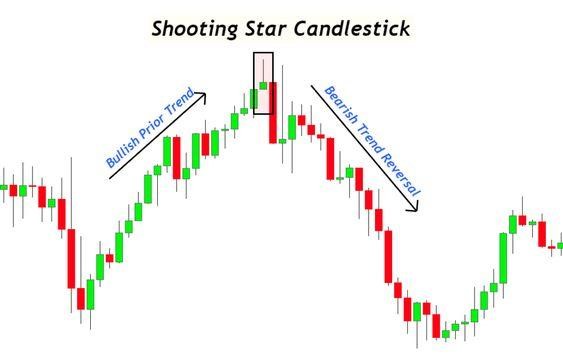
Il pattern Stella Cadente è composto da un corpo piuttosto piccolo e da un lungo stop superiore. Questo modello appare dopo un trend al rialzo. Spesso indica una possibile inversione verso un trend al ribasso. Il grafico della Stella Cadente descrive una situazione in cui il prezzo di un asset è quasi allo stesso livello all'apertura e alla chiusura delle contrattazioni. Si tratta di un segnale ribassista che di solito significa che il trend al rialzo non è più supportato. Tuttavia, i trader dovrebbero anche analizzare altri segnali di trading che possono confermare questa tendenza, poiché a volte il pattern Stella Cadente può indicare una pausa temporanea in un trend al rialzo piuttosto forte.
Spinning Top
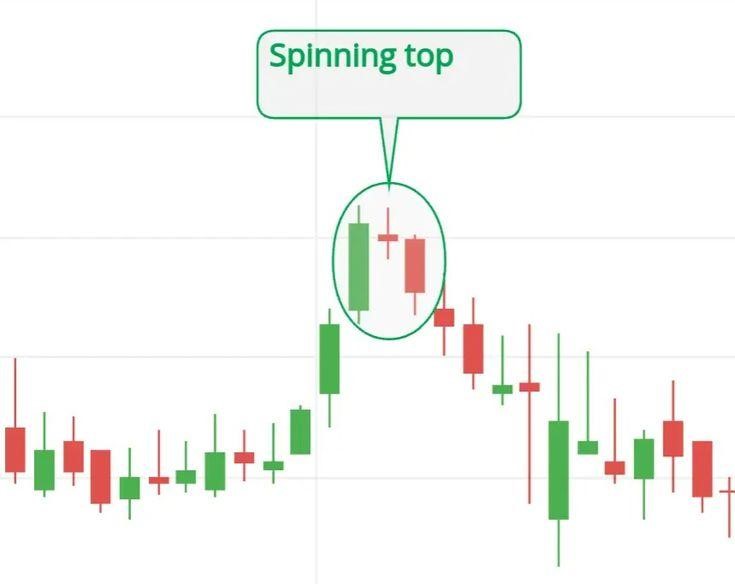
Questo pattern ha un corpo principale corto situato verticalmente al centro. Le forme superiori e inferiori sono piuttosto lunghe. Il pattern candlestick indica l'incertezza sulla direzione del trend. Lo Spinning Top spiega la situazione sul mercato quando né venditori né acquirenti sono riusciti a prendere il sopravvento.
Il pattern candlestick si forma quando gli acquirenti spingono il prezzo verso l'alto e i venditori spingono il prezzo verso il basso. Tuttavia, al momento della chiusura del mercato, il prezzo dell'attività è vicino a quello dell'apertura delle contrattazioni. Di conseguenza, uno Spinning Top di solito segnala l'incertezza sul mercato. Ma a volte può anche indicare un cambiamento potenzialmente significativo nei trend. In ogni caso, vale la pena aspettare la conferma della tendenza dai modelli di trading successivi prima di prendere una decisione.
Vantaggi e Svantaggi del Pattern Hanging Man
Lavorare con il Pattern Hanging Man ha diversi vantaggi significativi per il trading. Saranno più evidenti se questo modello viene rilevato precocemente. Tra gli effetti più utili dell'analisi grafica ci sono i seguenti.
- Miglioramento della gestione del rischio. I trader possono implementare strategie più efficaci basate su un'analisi dettagliata delle tendenze di mercato. Ad esempio, il segnale della candela Hanging Man indica quando coprire posizioni o regolare i livelli di stop loss.
- Promozione di una migliore diversificazione del portafoglio di investimenti basata su un'analisi più qualitativa delle condizioni di mercato e del comportamento di vari asset. Aumenta inoltre la stabilità complessiva del portafoglio.
- Aumento della fiducia nel trading migliorando i punti di ingresso e di uscita. Ad esempio, una candela confermata Hanging Man segnala il punto di ingresso ottimale sul mercato per una posizione corta o il punto di uscita ideale per ottenere profitti dalle posizioni lunghe esistenti.
- Orientamento più efficace nei mercati finanziari. Utilizzando il Pattern Hanging Man, i trader possono concludere affari con maggiore sicurezza, poiché la ricerca dettagliata è alla base delle decisioni ragionevoli.
Modello Hanging Man nel Trading Forex: Consigli e Trucchi
Hanging Man Forex è un pattern particolarmente utile per il trading. La sua identificazione consente agli investitori di riconoscere i segnali di un'inversione di tendenza in una fase precoce. Si tratta essenzialmente di un indizio visivo per i trader che suggerisce che è necessaria cautela in un determinato momento.
In questo modo, possono uscire dalle posizioni lunghe in tempo, anticipando un potenziale declino. Tali previsioni sulle tendenze di mercato aiutano gli investitori non solo a proteggere i loro asset da potenziali minacce, ma anche ad aumentarli.