To predict the future behavior of a person, you need to assess their mood. It can be quite volatile, but it strongly influences and sometimes even directly determines a person's actions. The same applies to the markets: to predict the further movement of the price of any asset, traders need to estimate the sentiment of the market or the willingness of buyers and sellers to conclude deals at current prices.
Candlestick analysis, which has been effectively used by traders for several centuries, helps to unravel the psychology of the quotes movement. Read the article to find out why 3 candlestick patterns are the most useful technique for analyzing market sentiment, and what conclusions can be drawn from them to improve trading efficiency.
Understanding Triple Candlestick Patterns
One of the main tasks of technical analysis is to determine optimum periods for opening and closing trading positions. The more accurate analytical tools you use, the more benefit you may derive from the deal.
- The study of even one candle gives the trader such essential information as the market trend — bullish or bearish, the price of the asset at the time of opening/closing trading, and the minimum and maximum price at which the asset was traded.
- Double candlestick patterns allow you to get not only a signal but also its confirmation, which makes them a more accurate tool for market analysis.
- However, the 3 candle pattern is the most reliable for predicting future market behavior because it takes into account the nature of trading during 3 consecutive trading sessions.
Therefore, if you want to get a guaranteed winning trade, you should analyze exactly the combination of 3 candlesticks, which indicate the continuation or reversal of the trend. And in order not to be mistaken in your analysis, rely on the best Forex robots, which perfectly conduct all types of candlestick analysis.
The Most Common Triple Candles
Since each candle contains as many as four indicators, combinations of three candles will give millions of patterns. However, only a few of them are significant for trading, which have proven themselves as reliable during their application. Get to know the most popular of them and evaluate the heuristic value of triple candlestick patterns.
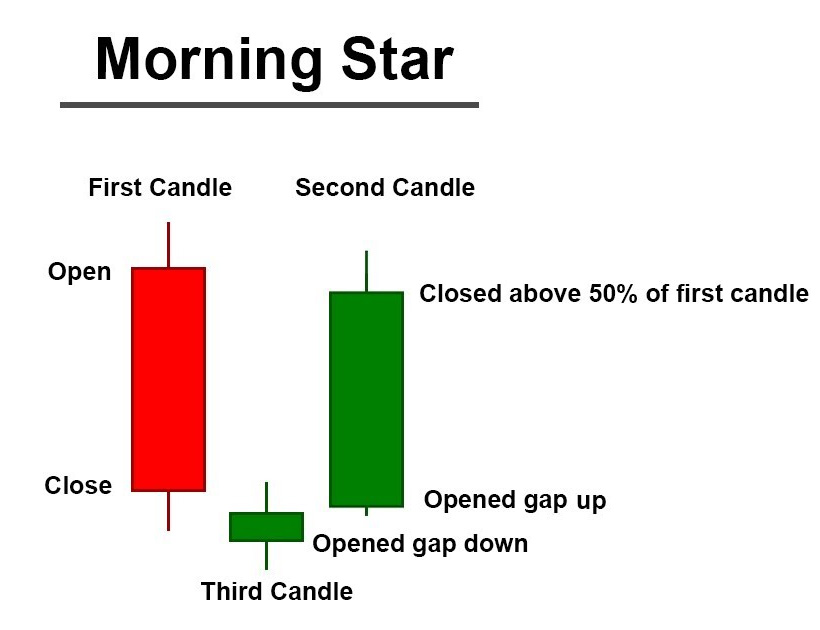
Morning Star
The growth of the market is like the rising of the sun. That is why the change in trend from bearish to bullish was called so romantic. It consists of 3 interconnected candles:
- A long bearish candle is like a long night.
- A short bearish or bullish candle indicates a downtrend stop.
- A long bullish candle is a harbinger of an uptrend.
Evening Star
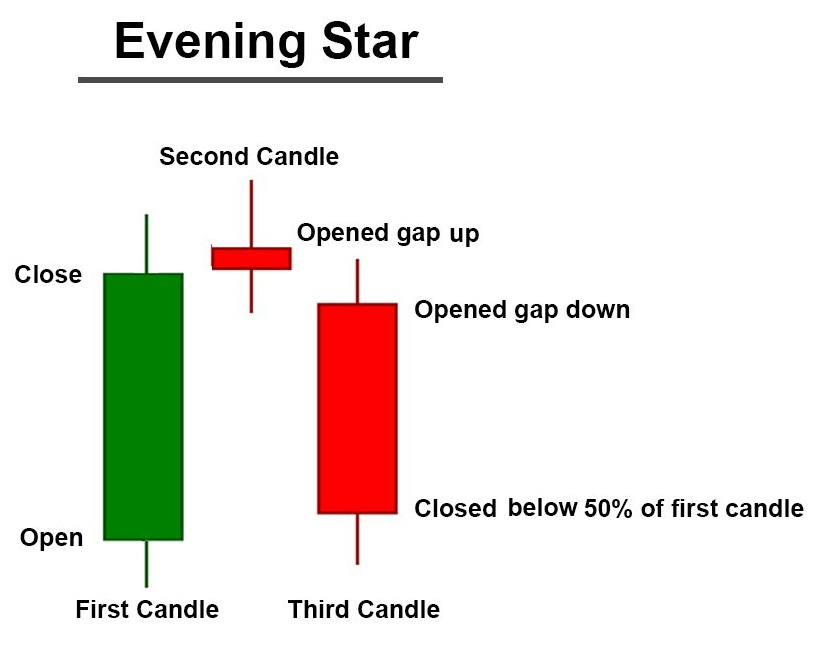
An approaching bearish trend is predicted by the opposite pattern:
- The first candle is long bullish, which indicates the dominance of buyers.
- The second candle is short bullish or bearish, demonstrating market uncertainty and selling pressure.
- The third candle is long bearish, witnessing the victory of the downtrend.
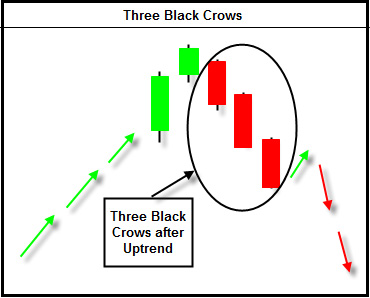
Three Black Crows
The end of an uptrend is foreshadowed by three bearish candles following one after another. Since they are all three black, this inspired traders for such an eloquent name for the indicator. The second and third candles form below the previous one, indicating that the pessimistic mood in the market has come in earnest, which means it's time to place sell orders.
Three White Soldiers
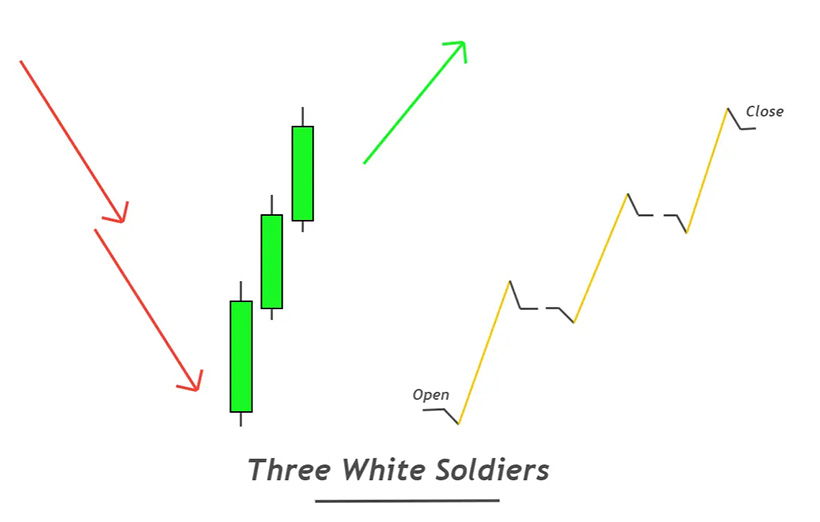
This pattern is the exact opposite of the Three Black Crows as you will see three white candles that follow each other. Each subsequent one is formed inside the body of the previous one and rises above it. This signals a return to the bull market, which means you can place buy orders.
Doji
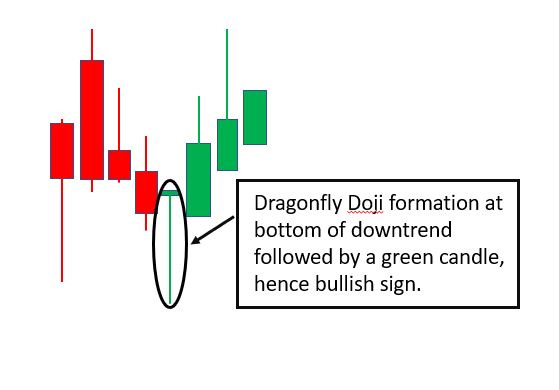
The triple candle pattern can also indicate market indecision when the trend is not yet reversed, but you need to prepare for this. In such a situation, you will see two candles of different colors on the sides and a candle with a thin body and long shadows inside of the pattern. This means that trading opened and closed almost at the same level.
How to Trade Triple Candlestick Patterns
- Candlestick analysis is a self-sufficient branch of technical analysis, so you can rely on the well-established three candlestick patterns when placing orders.
- It can also be used in addition to other technical analysis methods to confirm signals. To save you from false signals, you can support the detection of these patterns with the estimation of trading volumes.
- To minimize risks while trading based on candlestick analysis, set Stop Loss and Take Profit. Each case should be analyzed separately, depending on the specific candle pattern, but in general, they can be set 10 pips above or below the last fixed local maximum for Take Profit and 10 pips below for Stop Loss.
Limitations of Triple Candlesticks in Forex
When you look at the 3 candle patterns individually, everything may seem obvious to you. But on price charts, you will see candles that form a lot of patterns. Their diversity can sometimes confuse even professionals, not to mention beginners. Therefore, it is best to use the best Forex robots in order not to waste time and money on false signals.
The Bottom Line
When starting candlestick analysis, do not try to cover all the variety of combinations. It is better to choose no more than 10-12 of the most effective patterns, which you can easily distinguish on the charts. At first, do not rush to place large orders, but note the appearance of this pattern, make a prediction, and see how the price will behave further. And if your prediction and the actual price movement match, you can move on to confident trading.

