Die technische Analyse ist ein integraler Bestandteil des Forex-Handels. Dies ist eine Reihe von Tools, die entwickelt wurden, um Diagramme zu untersuchen und fundierte Entscheidungen zu treffen. Die Hauptannahme der Methode der technischen Analyse ist die Idee, dass Preisschwankungen Veränderungen in der Zukunft verursachen. Um die Bewegung der Preisentwicklung vorherzusagen, haben Trader, Analysten und Mathematiker viele Indikatoren erfunden.
Die Hauptindikatoren helfen den Forex-Teilnehmern, den aktuellen Marktzustand, seine potenzielle Richtung und die Stärke der Trends zu untersuchen. Die häufigsten und effektivsten technischen Tools sind in bekannten Handelsplattformen wie MetaTrader 4 enthalten. Im Folgenden werden wir die besten Indikatoren für MT4 erkunden. Sie werden erfahren, wie sie funktionieren und wie man sie effektiv einsetzt.
Was sind MT4-Indikatoren?
MT4-Handelsindikatoren sind spezielle Tools, die entwickelt wurden, um Vorhersagen über Preisänderungen an den Finanzmärkten zu treffen. Sie basieren auf der eingehenden Analyse historischer Daten, Handelsvolumina und anderer Variablen. Solche Tools helfen Tradern, wichtige Markttrends, Unterstützungs- und Widerstandsniveaus, die Stärke des Trends und potenzielle Umkehrpunkte zu identifizieren. Die richtige Wahl der Indikatoren kann die Effektivität einer Handelsstrategie erheblich steigern. Hier ist eine Liste der Funktionen, die die besten Indikatoren ausführen können:
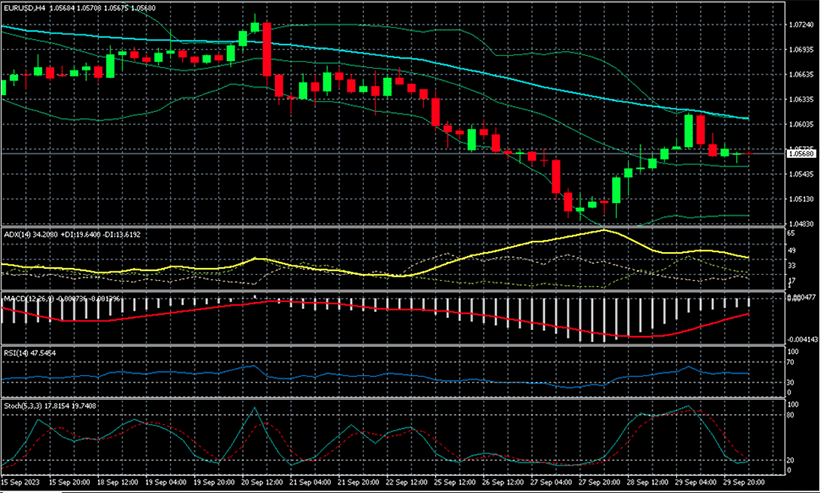
- Trendanalyse. Handelsindikatoren helfen dabei, die allgemeine Preisrichtung zu verstehen ― aufwärts, abwärts oder seitwärts. Das offensichtlichste Beispiel sind gleitende Durchschnitte.
- Bestimmung des Momentums. Indikatoren wie RSI (Relative Strength Index) oder Stochastik messen die Geschwindigkeit der Preisbewegung, um festzustellen, wie stark der aktuelle Trend ist.
- Volatilitätsbewertung. Dies ist ein Maß dafür, wie stark sich die Preise ändern. Volatilitätsindikatoren helfen dabei, das Maß an Marktunvorhersehbarkeit zu verstehen.
Die MT4-Plattform unterstützt Standardtechnische Indikatoren, die wir unten studieren werden, und benutzerdefinierte Indikatoren, die Benutzer leicht installieren können. Dazu sollten Sie eine spezielle MQL4-Datei herunterladen und sie zur Liste der MT4-Indikatoren hinzufügen. Wenn Sie jedoch Anfänger sind, werden Sie mit dem Standardset vollkommen zufrieden sein.
Kriterien zur Auswahl der besten MT4-Indikatoren
Wenn wir von "besten MT4-Indikatoren" sprechen, stellt sich die Frage: "Nach welchen Kriterien bewerten wir einen Indikator als den besten?" Leider hat diese Frage keine eindeutige Antwort. Trader streben danach, das Werkzeug zu finden, das andere übertrifft, aber sie haben nie Erfolg. Der Grund dafür ist, dass verschiedene Indikatoren gut darin sind, verschiedene Aufgaben zu lösen. Daher sollten wir eine Kombination der Werkzeuge einsetzen. Hier sind einige Kriterien, die unser Werkzeugset erfüllen muss:
- Profit/Risiko-Verhältnis. Wenn der Indikator mehr echte Signale als falsche liefert, betrachten wir ihn als effektiv. Das Verhältnis kann variieren, und viele Trader suchen nach den kostenpflichtigen Werkzeugen mit dem besten Ruf.
- Einfachheit der Verwendung. Einige Indikatoren sind zu fortschrittlich für normale Forex-Teilnehmer. Sie können mehr Zeit damit verbringen, den Chart zu analysieren, als eine Entscheidung zu treffen. Einfache Werkzeuge wie MAs oder RSI hingegen geben sofortige Einblicke.
- Anpassung an Ihren Zeitrahmen. Der beste MT4-Indikator sollte zu Ihrer Strategie passen und in einem bestimmten Zeitrahmen nützlich sein.
- Preis. Einige Trader suchen nach den teuersten Indikatoren, aber sie werden nicht immer zu magischen Pillen, die Ihre Leistung dramatisch steigern.
Überraschenderweise streben professionelle Trader nicht nach den ausgefeiltesten Werkzeugen. Sie verlassen sich hauptsächlich auf den Chart und die einfachsten Werkzeuge, die auf der MT4-Plattform verfügbar sind.
Top MT4-Indikatoren
Benutzer können im Internet die Top 3, Top 7 oder Top 10 MT4-Indikatoren finden. Offensichtlich ist die Auswahl subjektiv. Wir haben die Werkzeuge zusammengestellt, die unterschiedliche Zwecke erfüllen und in verschiedene Strategien eingebunden werden können. Hier ist unsere Liste:
- Gleitende Durchschnitte;
- Relative Stärke Index;
- Bollinger-Bänder;
- Konvergenzdivergenz des gleitenden Durchschnitts;
- Fibonacci-Retracement;
- Stochastischer Oszillator;
- Heikin Ashi.
Die meisten von ihnen wurden vor Jahrzehnten entwickelt und haben ihre Wirksamkeit bewiesen. Im Folgenden erfahren Sie, wie Sie sie verwenden und warum sie funktionieren.
Gleitender Durchschnitt (MA)
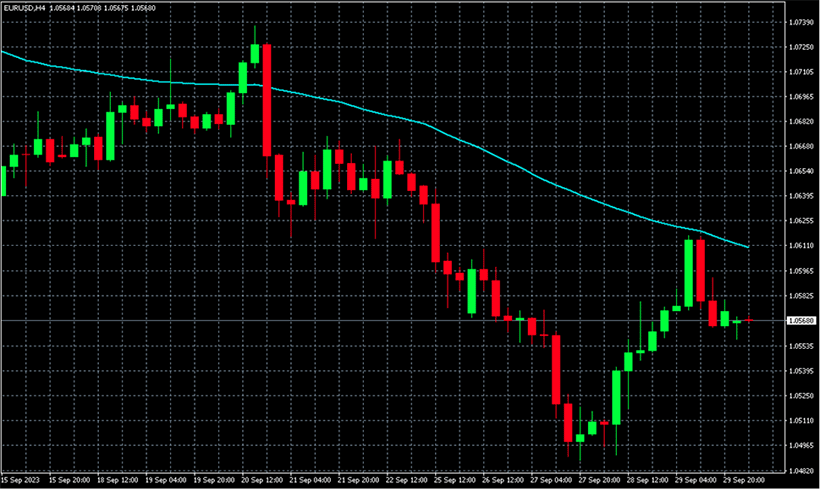
Gleitende Durchschnitte sind Trendindikatoren. Sie ermöglichen es Ihnen, die allgemeine Richtung des Trends zu erkennen und Schwankungen auszugleichen. Die Methode basiert auf der Berechnung des mittleren Preises für einen bestimmten Zeitraum. Neben der Trendrichtung betrachten Trader oft die Schnittpunkte, die die Stärke eines Trends anzeigen. MAs werden auch zur Berechnung von Unterstützungs- und Widerstandsniveaus verwendet. Dies ist eines der einfachsten Werkzeuge der technischen Analyse und möglicherweise der beste Trendindikator MT4.
Relative Stärke Index (RSI)
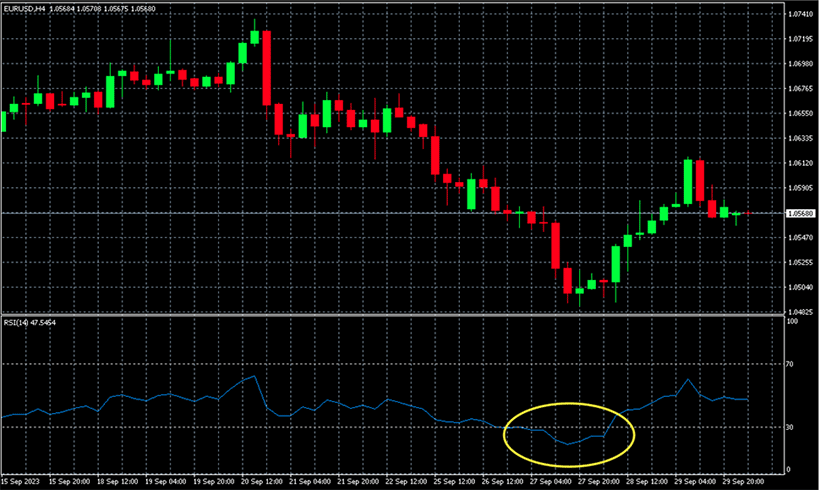
Der RSI wurde 1978 vom berühmten Analysten John Welles Wilder entwickelt. Er wird verwendet, um die Stärke und Geschwindigkeit der Preisänderung eines Währungspaares auf dem Devisenmarkt zu messen. RSI ist ein Oszillator, der die überkauften oder überverkauften Niveaus des Finanzinstruments anzeigt.
Um den Indikator zu berechnen, sollten Sie den durchschnittlichen Gewinn und den durchschnittlichen Verlust über einen bestimmten Zeitraum vergleichen (normalerweise 14 Kerzen). Dies ermöglicht es Ihnen festzustellen, wann der Preis seinen größten oder kleinsten Wert erreicht hat. Bei Verwendung des RSI gelten Werte über 70 als überkauft und unter 30 als überverkauft. Sie zeigen die richtigen Momente für das Öffnen oder Schließen von Positionen an.
Um den RSI zu verwenden, müssen Sie seine Parameter konfigurieren und Signalniveaus definieren. Wählen Sie zunächst den Zeitraum aus. Wilder empfahl die Verwendung von 14 Perioden (z. B. Tage). Ändern Sie dann die Niveaus, wenn Sie 70 und 30 für unangemessen halten. In MetaTrader 4 können Sie andere Einstellungen anpassen und die Kurve unter dem Preisdiagramm sehen.
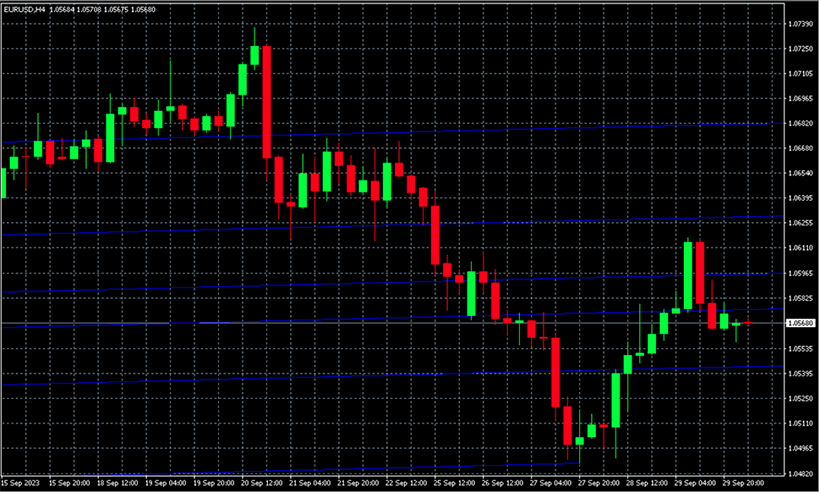
Bollinger-Bänder
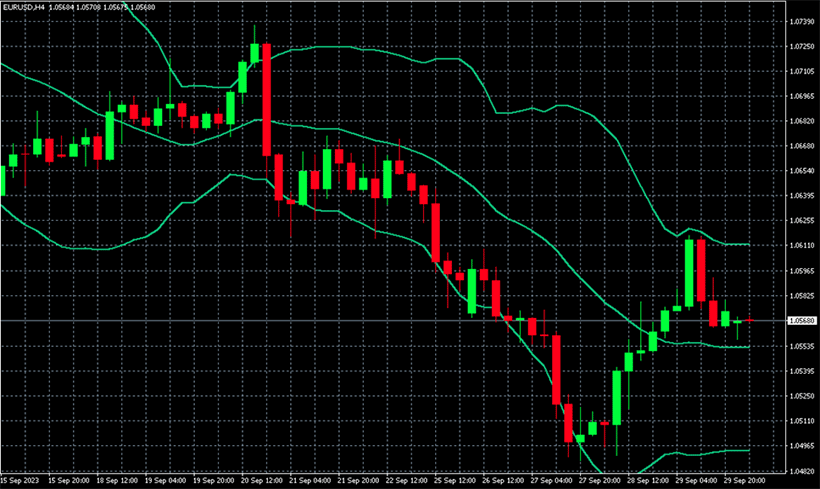
Der Bollinger-Bänder-Indikator wird auch häufig in MT4 verwendet. Er kann dabei helfen, die Marktvolatilität zu bestimmen und weitere Preisbewegungen vorherzusagen. Der Indikator sieht aus wie ein Kanal, der aus zwei Linien besteht. Eine davon befindet sich über der Preisentwicklung, die andere darunter.
Die Breite des Bands zeigt deutlich an, wie volatil der Markt ist. Ein enger Bollinger-Bänder-Kanal deutet auf einen ruhigen Markt hin, während seine Ausdehnung uns über die extreme Volatilität informiert. Beim Handel mit diesem Indikator berücksichtigen Händler, wie sich der Preis innerhalb der Linien verhält.
MACD (Moving Average Convergence Divergence)
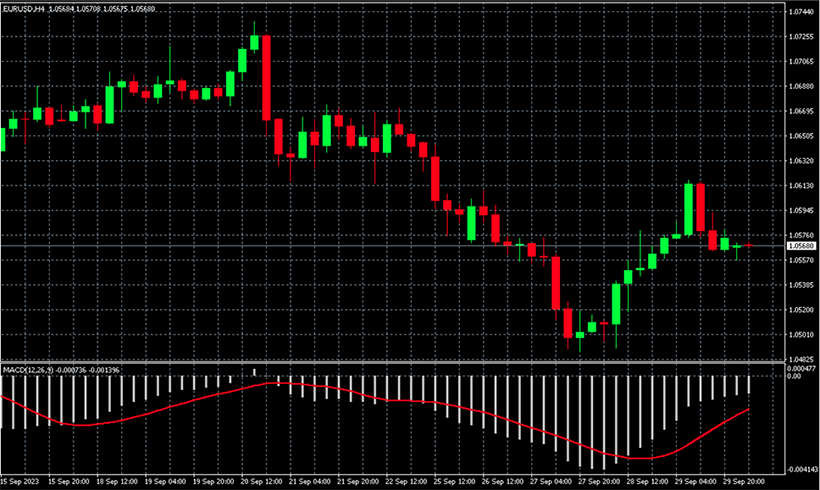
Der MACD (Moving Average Convergence/Divergence)-Indikator wird verwendet, um Trends zu finden. Sobald Sie ihn in MT4 aktivieren, sehen Sie zwei Linien. Eine wird rot sein, die andere - blau. Sie können sich schneiden oder auseinandergehen. Jede Linie ist ein gleitender Durchschnitt eines bestimmten Zeitraums (einer ist immer kürzer als der andere).
Wenn der schnellere MA den langsameren kreuzt, können wir eine Annahme über das Entstehen eines neuen Trends machen. Eine weitere Divergenz dieser beiden Linien wird die Entwicklung des Trends anzeigen. Das Histogramm zeigt die Stärke des Trends an: Je länger die Balken, desto stärker der Trend. Sobald die schnelle Linie zurückkehrt und die zweite Linie erneut kreuzt, können Sie eine Trendumkehr erwarten.
Fibonacci-Retracement
Korrektur oder Retracement ist eine Bewegung gegen den bestehenden Trend. Sie verbraucht typischerweise einen Teil der Trendbewegung, ohne die Hauptrichtung zu beeinflussen. Um die Korrekturlevel zu berechnen, ist das Fibonacci-Retracement-Tool in der Regel nützlich. Die häufigsten Level sind 38,2%, 50%, 61,8% und 78,6%. Sie werden aus der vorherigen Trendbewegung berechnet.
Korrekturlevel werden automatisch in MT4 auf den Hochs und Tiefs der Kerzen aufgebaut. Um horizontale Linien zu erstellen, die Ihnen helfen, Orders zu platzieren, müssen Sie zunächst einen Trend finden. Sie können andere Indikatoren verwenden, um den Beginn zu erkennen und die erste Linie als 0%-Level festzulegen. Finden Sie dann das Fibonacci-Retracement-Tool in der Menüleiste und aktivieren Sie es.
Stochastischer Oszillator
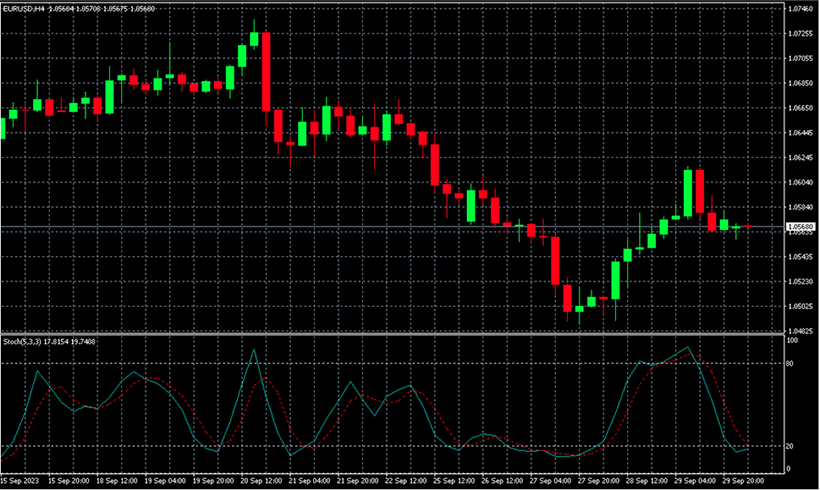
Der stochastische Oszillator befindet sich unter dem Hauptpreisdiagramm und vergleicht den Schlusskurs der Balken mit dem vorherigen Intervall. Es handelt sich um ein Instrument, das mit zwei Linien dargestellt wird. Die erste zeigt den Wert des Indikators selbst, und die zweite den Wert seines MA. Der stochastische Oszillator kann für verschiedene Zeiträume berechnet werden, aber das häufigste Zeitintervall beträgt 5 Tage.
Der Indikator wird als Prozentsatz dargestellt. Liegt der Wert über 80, ist der Schlusskurs nahe dem oberen Bereich, liegt er unter 20, ist er nahe dem unteren Bereich. Viele Händler betrachten ihn als den besten Indikator MT4, da sie viele Signale daraus erhalten können. Hier sind die Parameter, auf die Sie achten sollten:
- Divergenz mit der Preisentwicklung;
- Das Niveau der stochastischen Linien;
- Die Richtung der Linien.
Der Indikator kann die Umkehrung und den Beginn eines neuen Trends signalisieren. Wenn zum Beispiel die Hauptkurve über 80 liegt und zwei Spitzen bildet, während die Preise weiter steigen, könnte der bärische Trend beginnen. Das bullische Signal ist ein doppelter Boden unter dem Niveau von 20.
Heikin Ashi
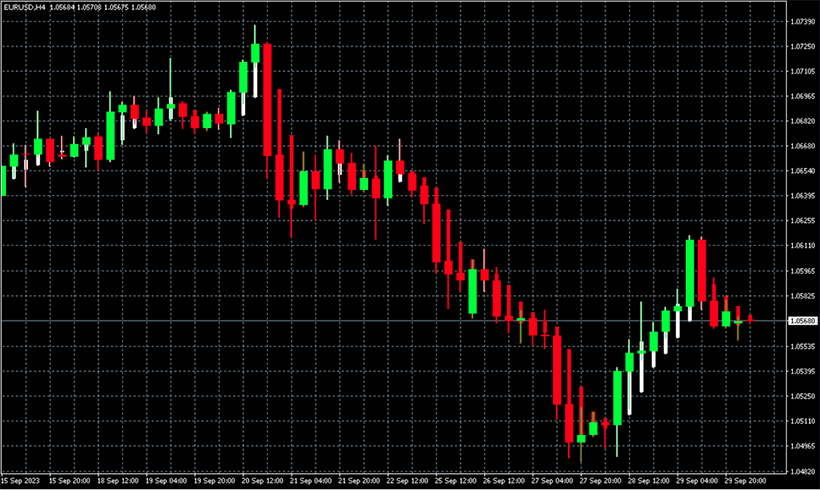
Heiken Ashi ist eine alternative Technik zur Darstellung von Preisbewegungen. Es ähnelt einem regulären Kerzenchart, hat aber bestimmte Besonderheiten. Zum Beispiel ermöglichen Heiken Ashi-Charts nicht das Lesen der tatsächlichen Preisniveaus, erleichtern jedoch das Verfolgen der Entwicklung von Trends und ihrer Umkehrungen.
Das Hauptziel von Heiken Ashi ist die Darstellung des Preisverlaufs. Deshalb sehen sie aus wie eine geglättete Version japanischer Kerzen. Steigende Heiken Ashi Balken sind normalerweise weiß, und abwärts gerichtete Kerzen sind rot. Sie haben auch Dochte. Ein Wechsel der Farbe der Kerzen bedeutet eine Änderung des Trends. Rot zu weiß ist eine Umkehr des bärischen Trends, weiß zu rot ― eine Umkehr des bullischen Trends. Sie sind nützlich, wenn Sie die Marktbedingungen schnell bewerten müssen.
Kombination von Indikatoren für optimale Ergebnisse
Um ein hochprofitabler Trader zu werden, ist es notwendig, verschiedene Indikatoren zu kombinieren. Unter Hunderten von verschiedenen Kombinationen haben wir zwei Paare und eine grundlegende Vereinigung ausgewählt, die Ihnen helfen können, bessere Entscheidungen zu treffen:
- Gleitende Durchschnitte und MACD. Die Kombination von MAs und MACD ist effektiv, um den Trend zu analysieren und Kauf- oder Verkaufssignale zu geben. Wenn die schnelle MACD-Linie die langsame Linie nach oben kreuzt und über der MA-Linie liegt, kann dies auf einen möglichen Preisanstieg hinweisen. Gleichzeitig kann ein Preis über den gleitenden Durchschnitten als Kaufsignal interpretiert werden.
- RSI und Bollinger-Bänder. Die beiden oben genannten technischen Indikatoren können gut zusammenpassen. Wenn der RSI über 70 (oder 80) liegt, kann dies auf überkaufte Bedingungen und einen möglichen Preisrückgang hinweisen. Bollinger-Bänder, die die Preisvolatilität anzeigen, können zusätzliche Einblicke über den Einstiegspunkt geben.
- Grundlegende und technische Analyse. Die technischen Tools sind äußerst wichtig, aber ihre Effizienz kann erheblich gesteigert werden, indem grundlegendes Verständnis hinzugefügt wird. Wenn Sie zum Beispiel ein Kaufsignal sehen, aber gleichzeitig ein Wirtschaftsbericht veröffentlicht werden soll, ist es besser, zu warten, bis er veröffentlicht wird, um mögliche Risiken zu vermeiden.
Bei der Auswahl der besten MT4-Indikatorenkombination sollten Sie Ihren Handelsstil, Ihre Vorlieben und Ihre Erfahrung berücksichtigen. Verwenden Sie nicht zu viele Indikatoren, da dies zu einem überfüllten Chart führen und die Analyse erschweren kann. Es ist besser, einige grundlegende Tools auszuwählen und gründlich zu untersuchen, wie sie zusammenarbeiten.
Übliche Fehler, die vermieden werden sollten
Das reine Candlestick-Diagramm liefert den Händlern viele Informationen, aber die Analyse von Candle-Mustern ist nicht so einfach wie die Verwendung der integrierten Indikatoren von MetaTrader 4. Deshalb beginnen Anfänger, sich mit den verschiedenen technischen Tools zu beschäftigen und machen viele Fehler. Hier sind einige davon:
- Hohe Erwartungen. Die meisten Anfänger denken, dass Indikatoren nie Fehler machen und dass es kostenpflichtige Tools gibt, die wie eine Geldmaschine funktionieren werden. Das ist nicht wahr. Sie sollten immer die Risiken verstehen und entsprechend handeln.
- Überlastung mit Indikatoren. Das Kombinieren verschiedener Tools ist eine gute Idee, es sei denn, Sie platzieren mehr als drei Instrumente auf dem Chart. In diesem Fall lenken sie nur Ihre Aufmerksamkeit ab.
- Vernachlässigung des Bankroll-Managements. Selbst wenn Sie sich auf das Signal verlassen, sollten Sie Ihr Budget im Auge behalten. Andernfalls kann ein Margin Call erscheinen.
Kein Händler kann es vermeiden, Fehler zu machen, aber wenn Sie potenzielle Fallstricke kennen, können Sie aus ihnen lernen und die gleichen Probleme in Zukunft vermeiden.
Schlussfolgerung
MT4-technische Analyseindikatoren sind wichtige Tools zur Bewertung des Devisenmarktes und zur Entscheidungsfindung beim Handel. Die Verwendung solcher Tools hilft, mögliche Ein- und Ausstiegspunkte zu identifizieren. Aus diesem Beitrag haben Sie die besten 7 kostenlosen Indikatoren für MT4 und deren Kombinationen gelernt. Das Beherrschen des Handels erfordert Aufmerksamkeit und ein tiefes Verständnis der Hauptwerkzeuge.
Um jedoch Ihre Arbeit zu automatisieren, benötigen Sie andere Instrumente. Eine gute Option zur Steigerung der Produktivität sind die besten Forex-Roboter. Sie können schnell Dutzende von Indikatoren analysieren und Ihnen professionelle Ratschläge geben. Üben Sie weiter, und Sie werden in der Lage sein, enorme Ergebnisse auf dem Finanzmarkt zu erzielen.