Der Devisenhandel erfordert von den Händlern, die Parameter sorgfältig zu studieren, die den Zustand des Marktes beschreiben. Der wichtigste Parameter ist der Preis. Seine Veränderungen sind die Grundlage des Handels und der Schlüssel zur Gewinnerzielung. Es gibt auch wichtige Indikatoren wie das Niveau der Volatilität, Liquidität und andere. Kein Instrument liefert jedoch so viele wichtige Informationen wie das Handelsvolumen.
Die Verfolgung von Volumenänderungen ist eine wichtige Aufgabe für einen Devisenhändler. Es kann Ihnen helfen, das Auftreten eines neuen Trends im Voraus vorherzusagen. Eines der technischen Tools zur Überwachung dieses Parameters ist der On-Balance-Volume-Indikator (OBV). Es handelt sich um einen beliebten Momentum-Indikator, den Händler zur Vorhersage von Preisbewegungen verwenden. In diesem Artikel erfahren Sie, wie Sie den On-Balance-Volume-Indikator verwenden, wie Sie ihn berechnen und wie Sie ihn in Ihre Strategien integrieren können.
Was ist der On-Balance-Volume (OBV) Indikator?
Der On-Balance-Volume-Indikator ist ein technisches Analysewerkzeug, das vor über 60 Jahren von Joseph Granville entwickelt wurde. Ursprünglich wurde der Indikator verwendet, um Aktienkurse zu bestimmen, später wurde er jedoch erfolgreich von Devisenhändlern eingesetzt.
Der Erfinder des OBV erklärte, dass das Handelsvolumen ein entscheidender Faktor ist, der den Markt beeinflusst. Er beschrieb eine einfache Formel für das On-Balance-Volume, die half, den Indikatorwert zu berechnen und eine Volumenänderungskurve zu zeichnen.
Die Richtung der Kurve kann schnell eine Zunahme oder Abnahme des Handels eines bestimmten Währungspaares zeigen, und Abweichungen vom Preisdiagramm liefern noch mehr Informationen für die Analyse. Jetzt, da Sie wissen, was OBV bedeutet, ist es an der Zeit zu lernen, wie man es berechnet.
OBV Formel und Berechnung
- OBV = OBV (vorher) + aktuelles Periodenvolumen (Wenn der Schlusskurs größer ist als der vorherige Schlusskurs).
- OBV = OBV (vorher) - aktuelles Periodenvolumen (Wenn der Schlusskurs kleiner ist als der vorherige Schlusskurs).
- OBV = OBV (vorher) (Wenn der Schlusskurs gleich dem vorherigen Schlusskurs ist).
Interpretation von OBV
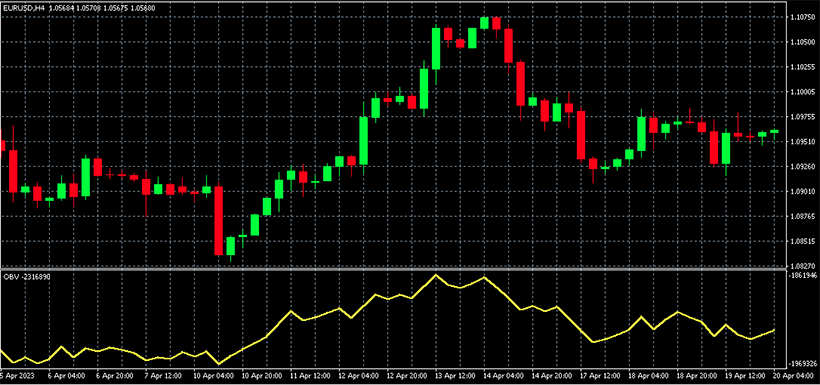
Die nächste Frage nach "Was ist der OBV-Indikator?" lautet "Wie wird er interpretiert?" Beim Interpretieren des OBV-Diagramms ist es wichtig zu verstehen, dass das Volumen ein wichtiger Marktinidikator ist und seine Bewegung eine Veränderung des Marktsentiments und potenzielle neue Trends anzeigt. Daher kann das On-Balance-Volume zwei mögliche Szenarien vorwegnehmen.Der erste ist die Bestätigung des Trends. Wenn beispielsweise Käufer zuversichtlich sind in das Wachstum des Preises und immer mehr kaufen, dann steigt das Volumen. In diesem Fall wird der bullische Trend durch einen wachsenden OBV-Graphen bestätigt. Das Auftreten neuer Höchststände sagt den Händlern, dass der Trend stark genug ist.
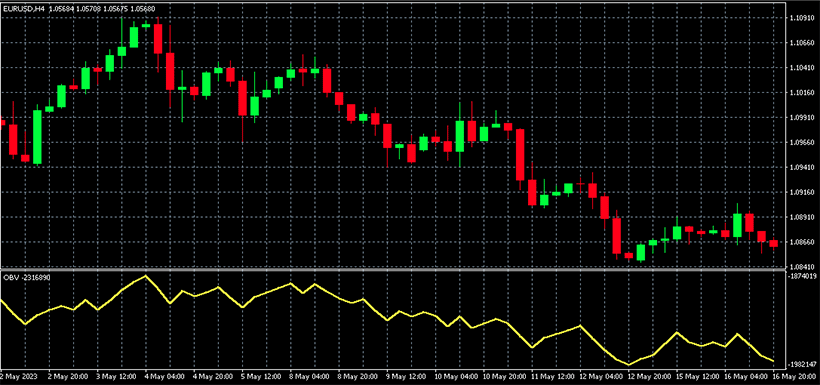
Die gegenteilige Situation ist eine Divergenz. Wenn beispielsweise der Preis-Trend eine stetige Zunahme zeigt und der On-Balance-Volume-Chart in die entgegengesetzte Richtung geht. In diesem Fall kann dies auf einen erhöhten Verkaufsdruck und eine mögliche Umkehr hinweisen.
Erfahrene Händler können auch falsche Ausbrüche von Unterstützungs- und Widerstandslinien mithilfe des OBV identifizieren. Dazu müssen Sie diese Linien im On-Balance-Volume-Chart zeichnen und sehen, ob die Kurve diese Linien durchbricht. Wenn der Preis-Ausbruch im OBV-Chart nicht bestätigt wird, ist es höchstwahrscheinlich falsch.
Wie man den On-Balance-Volume-Indikator verwendet
In dem vorherigen Abschnitt haben wir uns die Hauptmuster des OBV-Charts angesehen. Jetzt, da Sie verstehen, was das On-Balance-Volume ist, schauen wir uns an, wie es in die Praxis umgesetzt werden kann:
- Eröffnung eines neuen Handels und Festlegung eines Stop-Loss. Wenn der OBV eine Divergenz mit dem Preis-Chart zeigt, ist eine Umkehrung möglich. Sie können eine Long-Position in einem bärischen Trend oder eine Short-Position in einem bullischen Trend eröffnen. Im Falle einer Umkehrung fangen Sie den Anfang eines neuen Trends ein und können einen guten Gewinn erzielen.
- Halten einer Position. Wenn das On-Balance-Volume den Preis-Trend bestätigt und der Markt weiterhin selbstbewusst verkauft oder kauft, bedeutet dies, dass es zu früh ist, die Position zu schließen.
- Filtern von falschen Signalen. Ob Sie eine Umkehrung erwarten oder an einem Trend arbeiten, das Suchen nach falschen und echten Ausbrüchen hilft Ihnen dabei, das zukünftige Preisverhalten genauer zu bestimmen.
Neben der Analyse dieser offensichtlichen Signale des OBV-Indikators ist es auch wichtig, einigen Tipps zu folgen, die Ihnen helfen werden, eine praktische und effektive OBV-Handelsstrategie zu entwickeln:
- Verwenden Sie den OBV zusammen mit anderen Trendindikatoren und Oszillatoren. Dies wird Ihnen helfen, ein klareres Bild des zukünftigen Preisverhaltens zu erhalten.
- Verwenden Sie den OBV auf Zeitrahmen ab H1 und höher. Auf kurzen Zeitrahmen liefert er keine genauen Prognosen.
- Er liefert die genauesten Prognosen für hochliquide Paare wie EUR/USD oder BTC/USD.
- Riskieren Sie nicht große Geldbeträge, wenn Sie sich nur auf den OBV verlassen. Der Indikator kann falsche Signale liefern, und es ist besser, sie mit anderen Instrumenten zu überprüfen.
- Verwenden Sie Expertenberater, die automatisch eine große Menge an Daten analysieren und die Vorhersagen des OBV bestätigen können. Zum Beispiel können Sie die besten Forex-Roboter verwenden, um effektiver zu handeln und Ihre Strategie zu verbessern.
Mit diesen Tipps können Sie den Preis mithilfe des OBV genauer vorhersagen und den Markt insgesamt besser verstehen.
Vorteile der Verwendung von OBV
Der On-Balance-Volume-Indikator wird seit über einem halben Jahrhundert aktiv im Forex-, Aktienmarkt und einigen anderen Finanzmärkten eingesetzt. Eine solche Popularität und Langlebigkeit wären ohne offensichtliche Vorteile unmöglich:
- Einfache Handhabung. Der OBV hat eine einfache Formel und eine klare Bedeutung. Dies macht ihn zu einem idealen Werkzeug sowohl für Anfänger als auch für erfahrene Händler.
- Hohe Effizienz. Das Handelsvolumen hat einen erheblichen Einfluss auf den Markt, und seine Veränderungen liefern recht genaue Prognosen.
- Vielseitigkeit. Der OBV kann in verschiedene Strategien zur Trendumkehr oder -fortsetzung integriert werden.
Diese Merkmale des Tools sowie seine standardmäßige Präsenz in Handelsterminals machen es zu einem der beliebtesten Werkzeuge von Händlern.
Potentielle Fallstricke und Einschränkungen des OBV
- Das Handelsvolumen eines bestimmten Währungspaares ist schwer eindeutig zu bewerten. Die Daten können je nach Plattform variieren. Daher kann der OBV möglicherweise keine genauesten Prognosen liefern.
- Der OBV zeigt nur den allgemeinen Trend des Wachstums oder Rückgangs des Volumens und berücksichtigt nicht andere Marktbedingungen. In diesem Zusammenhang ist es wichtig, Signale durch andere, komplexere Tools zu bestätigen.
- Scharfe Änderungen im Volumen korrelieren möglicherweise nicht mit Preisänderungen und liefern falsche Signale.
- Da der OBV ein fundamentales Instrument ist, liefert er keine Informationen darüber, was tatsächlich auf dem Markt passiert. Zu jedem Zeitpunkt zeigt er nur eine Prognose.
Integration des OBV mit anderen Indikatoren
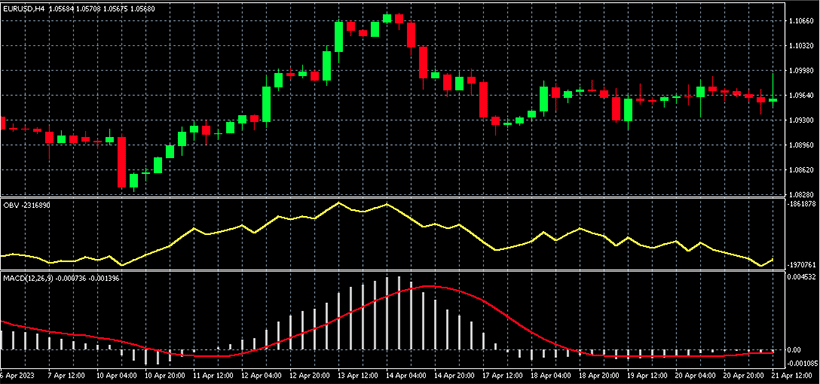
Trotz seiner fundamentalen Natur und Verbindung mit dem Hauptmarktparameter wird der On-Balance-Volume-Indikator häufiger verwendet, um einen Trend oder andere Signale zu bestätigen. Wenn sich der Markt also in einem starken bullischen oder bärischen Trend befindet, überprüfen Marktteilnehmer mit offenen Positionen ihn oft, um sicherzustellen, dass das Volumen in die gleiche Richtung geht.
Da der OBV ein führender Indikator ist, wird er häufig mit nachlaufenden Indikatoren ergänzt. Zusammen liefern sie ein umfassendes Bild und helfen, die Marktsituation besser einzuschätzen. Auch andere Momentum-Indikatoren werden manchmal zusammen mit dem OBV verwendet. Ein klassisches Beispiel ist der Moving Average Convergence/Divergence.
Die Integration mit anderen Tools ist ein grundlegender Bestandteil der Arbeit eines Traders. Kein technisches Instrument, auch das fortschrittlichste, kann eine 100% genaue Prognose garantieren. Deshalb müssen sie alle überprüft und ergänzt werden. Das Erlernen verschiedener Indikatoren zusammen mit persönlicher Erfahrung wird Ihnen helfen, Ihr Toolkit zu erstellen und es erfolgreich in Ihrer Strategie zu verwenden.
Das Fazit
Der OBV ist ein technisches Analysewerkzeug, das 1963 in die Handelspraxis eingeführt wurde. Seitdem wird es aktiv an den Aktien-, Devisen- und Kryptowährungsmärkten eingesetzt. Das Instrument misst das Handelsvolumen und vergleicht es mit dem Vermögenspreis. Dank dessen ist es möglich, Schlussfolgerungen über die Marktsentiment und potenzielle Preisänderungen zu ziehen. OBV ist eines der einfachsten Werkzeuge. Es liefert nicht viele spezifische Informationen, ist aber nützlich in Verbindung mit anderen technischen Werkzeugen. Zweifellos sollte jeder Trader wissen, wie man den OBV-Indikator verwendet.