Der Finanzmarkt ist eine dynamische und unvorhersehbare Umgebung, die von Hunderten von Faktoren abhängt. Im Laufe der Jahre haben Analysten und Händler jedoch gelernt, zukünftige Preisänderungen vorherzusagen und damit Geld zu verdienen.
Eine der führenden Methoden zur effektiven Handelsentscheidung ist die technische Analyse geworden. Sie umfasst eine Vielzahl von Indikatoren, Oszillatoren, Mustern und anderen Finanzinstrumenten. Japanische Kerzenmuster gehören zu den beliebtesten Instrumenten, da sie klare Signale ohne komplexe Berechnungen liefern.
Eines der Muster, auf das es sich lohnt zu achten, ist der Hammer. Tatsächlich handelt es sich hierbei nicht einmal um ein Muster, sondern um eine Kerze von spezifischer Form. Es ist leicht auf dem Chart zu erkennen und hat eine ziemlich eindeutige Interpretation. In diesem Artikel werden wir besprechen, wann der Forex-Hammer auf dem Graphen erscheint und wie man ihn nutzen kann, um maximalen Gewinn zu erzielen.
Was ist eine Hammer-Kerze?
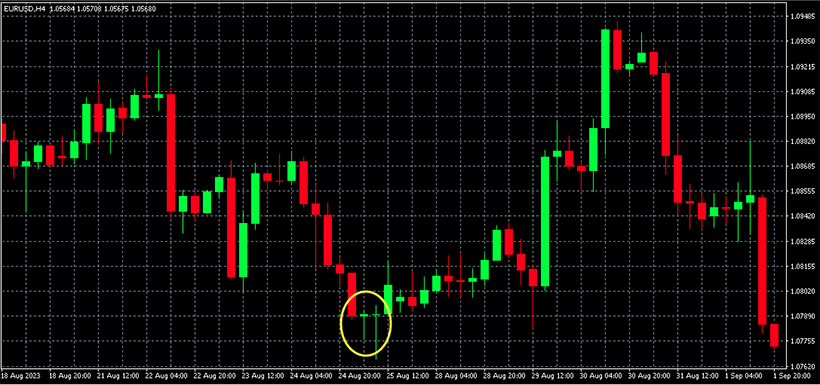
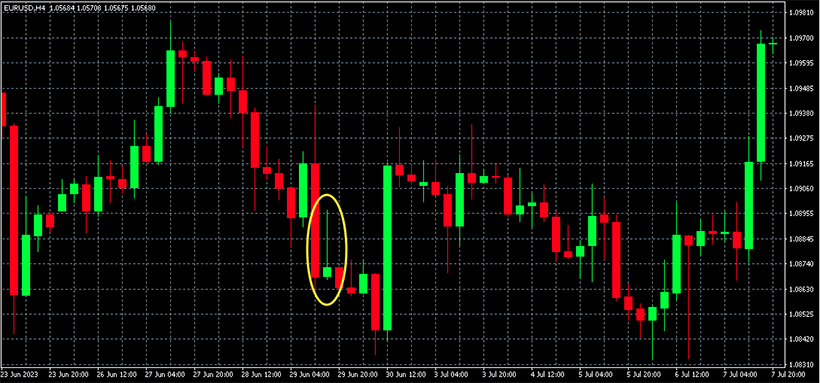
Händler unterscheiden zwischen ein-, zwei-, drei- und mehr-Kerzen-Mustern. Ein Hammer ist eine einzelne japanische Kerze, die eine mögliche Umkehrung der Preisentwicklung signalisiert. Er besteht aus einem langen unteren Schatten und einem kleinen Körper. Der obere Schatten ist sehr klein oder fehlt ganz. Meistens erscheint das Muster am Ende eines Bullentrends, nach einem signifikanten Preisrückgang.
Warum hat er diese Form? Wenn ein Trend an Stärke verliert, entsteht Unentschlossenheit auf dem Markt und es entsteht ein übermäßiger Kaufdruck. Dies führt zu einem kleinen Kerzenkörper. Ein langer Docht deutet auf einen signifikanten Rückgang des Vermögenspreises zu Beginn des Berechnungszeitraums hin.
Oft werden nach einer Hammer-Kerze die Käufer aktiver und setzen ihre Long-Positionen fort. Dies könnte der Beginn eines neuen Trends sein, und die Kurve wird nach oben drehen. Sicherlich kann die Kerze ein falsches Signal geben, daher sollten zusätzliche Instrumente zur Bestätigung verwendet werden. Nach dem ersten Hammer kann beispielsweise ein zweiter erscheinen, und die Schwäche des bärischen Trends wird noch offensichtlicher.
Wie identifiziert man das Hammerkerzenmuster?
Oben haben wir die Form des Hammerkerzenmusters erwähnt. Normalerweise sollte der untere Schatten mindestens 3-4 Mal größer als der Körper sein, damit das Signal zuverlässig ist. Tatsächlich ist die Form das Hauptmerkmal des Musters.
Zusätzlich ist der Standort der Kerze wichtig. Wenn Sie eine Trendumkehr erwarten, gibt der Hammer nur dann ein klares Signal, wenn er am Ende des Abwärtstrends steht. Sein Erscheinen deutet auf die Erschöpfung der Verkäufer und die wachsende Rolle der Käufer hin.
Was ist die umgekehrte Hammerkerze?
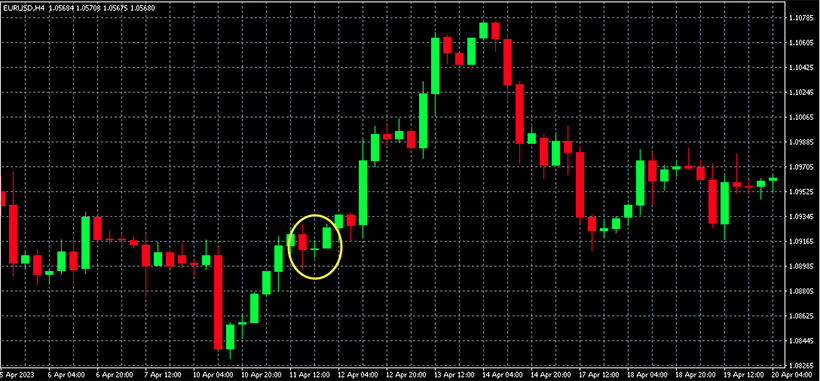
Neben dem geraden Muster finden Sie auch die umgekehrte Hammerkerze auf dem Chart. Die Bedeutung dieser Kerze ist ähnlich wie die des regulären Musters. Der Versuch, nach oben zu bewegen (langer oberer Docht) ist gescheitert, und der Preis kehrte schnell nach unten zurück. Die Farbe der Kerze ist ebenfalls wichtig. Eine grüne umgekehrte Hammerkerze am Ende eines Abwärtstrends wird als stärkeres bullisches Signal angesehen als ein rotes Hammerkerzenmuster. Insgesamt wird der Hammer in der Regel als klarerer Umkehrindikator als das umgekehrte Muster betrachtet.
Wichtige Merkmale von Hammer-Mustern
Lassen Sie uns die Hauptmerkmale der Hammerkerze betrachten. Dies wird Ihnen helfen, das Muster zu finden und ihre Bedeutungen zu verstehen:
- Der Körper des Hammer-Umkehrmusters ist viel kleiner als die Körper der meisten anderen Kerzen auf dem Chart. Allerdings ist er nicht abwesend.
- Der untere Docht sollte mindestens doppelt so lang sein wie der Körper, aber es ist besser, wenn das Verhältnis noch größer ist.
- Die Form der Hammer-Kerze zeigt die Konfrontation zwischen Bullen und Bären.
- Ein kleiner oder fehlender oberer Docht zeigt, dass die Käufer den Preis in der Berechnungsperiode kontrolliert haben.
- Rot oder weiß als Kerzenfarbe (die Farbe hängt von den Einstellungen Ihrer Handelsplattform ab) ist für Bullen wünschenswerter und gibt ein selbstbewussteres Signal.
- Ein langer unterer Schatten zeigt, dass die Verkäufer das Asset nicht mehr nach unten drücken können.
- Je länger der Schatten, desto genauer wird das Muster betrachtet.
Anfänger-Trader sollten aufmerksam sein und nicht überstürzt ein Asset kaufen, bis sie andere Indikatoren analysiert haben. Der Hammer ist ein starkes Signal, aber er erscheint ziemlich oft auf dem Chart und kann manchmal falsche Signale geben.
Unterschied zwischen Hammer und Doji
Anfänger können die Forex-Hammerkerze mit dem Doji verwechseln, aber es gibt einen Unterschied zwischen diesen beiden Mustern sowohl im Aussehen als auch in ihrer Bedeutung. Der Doji ist also auch ein Einzelkerzenmuster mit einem kleinen oder fehlenden Körper. Auch beim Doji gibt es keinen signifikanten Unterschied zwischen den Längen der unteren und oberen Schatten. Null Unterschied zwischen den Eröffnungs- und Schlusskursen zeigt die Unsicherheit des Marktes. Im Gegensatz zum Hammer ist der Doji jedoch nicht unbedingt ein bullishes Signal. Er kann in jedem Trend entstehen und ein potenzieller Vorläufer einer Umkehr sein. Wenn wir diese Kerzen nach Stärke vergleichen, ist der Hammer ein stärkeres Signal.
Hammer vs. Shooting Star
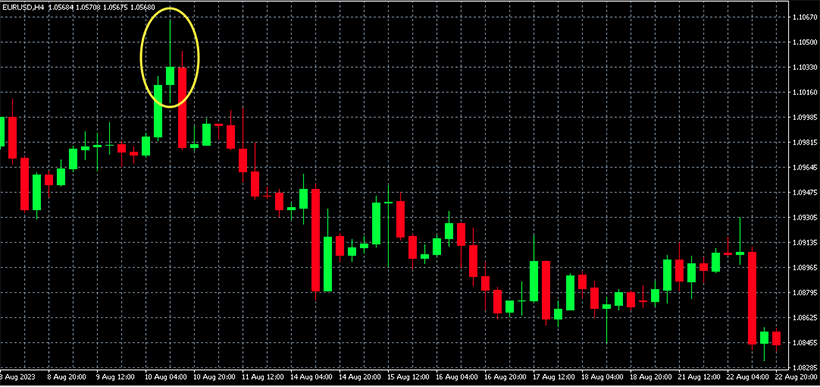
Das Shooting Star-Muster ähnelt dem umgekehrten Hammer, erscheint jedoch am Ende eines Aufwärtstrends und nicht eines Abwärtstrends. Die Kerze hat auch eine lange obere Docht und einen relativ kleinen Körper. Im Gegensatz zum Hammerindikator deutet der Shooting Star jedoch auf einen bärischen Trend hin.
Um ein Shooting Star auf dem Chart zu bilden, muss vorher ein Aufwärtstrend vorhanden sein. Die vorherige Kerze ist normalerweise grün (weiß) und zeigt die Aktivität der Käufer an. Dann versuchen die Bullen, den Preis weiter zu erhöhen, wie durch den langen Schatten belegt, können aber dem Druck der Verkäufer nicht standhalten. Als Ergebnis ist der Schlusskurs fast gleich dem Eröffnungskurs. Die Farbe der Kerze spielt keine Rolle.
Wie man mit dem Hammerkerzenmuster handelt
Die gesamte Handelsstrategie für das Muster kann nicht als Rat "öffnen Sie sofort eine Long-Position, nachdem die Kerze erscheint" erklärt werden. Es gibt mehrere Phasen, die jeder Trader verstehen sollte:
- Vergewissern Sie sich, dass der Chart einen "richtigen" Hammer hat. Das Muster sollte sich in einem Abwärtstrend befinden, und sein unterer Docht sollte mindestens doppelt so lang sein wie der Körper. Das Fehlen eines oberen Dochts wird ebenfalls ein günstiges Zeichen sein.
- Warten Sie auf Bestätigung. Sie sollten keine Position unmittelbar nach der Kerze eröffnen. Es ist besser, 1-2 weitere Kerzen zu sehen, die den bullischen Trend bestätigen. Sie können auch verschiedene Indikatoren wie den Relative Strength Index oder Parabolic SAR verwenden.
- Eröffnen Sie eine Long-Position. Tun Sie dies nach der ersten oder zweiten Kerze, nachdem der Hammer geschlossen ist.
- Folgen Sie dem Trend und nehmen Sie Gewinne mit. Stellen Sie unbedingt eine automatische Stop-Loss-Order ein. Schließen Sie den Handel gemäß Ihrer Risikomanagementstrategie.
Nach diesem ist es wichtig, erneut zu analysieren, welche Signale auf dem Chart waren und hätten Ihnen mehr Gewinn bringen können. Konstante Iterationen bei der Erstellung einer Strategie sind die Grundlage für profitables Trading.
Praktische Anwendung von Hammerkerzen
Für ein tieferes Verständnis des Hammer-Tradings können Sie sich auf andere Faktoren konzentrieren. Im Folgenden finden Sie einige Tipps, die bei der praktischen Anwendung des Musters helfen werden:
- Legen Sie einen 50-Tage-Durchschnitt auf den Chart und prüfen Sie, ob nachfolgende Kerzen sein Niveau durchbrechen. Wenn ja, besteht eine hohe Wahrscheinlichkeit für einen starken langfristigen Trend.
- Verwenden Sie Standard-Oszillatoren in MT4/5, um den Trend zu bestätigen. Beliebte Tools wie RSI und MACD sind gute Optionen.
- Wenn der Preis unter das Minimum des Hammers fällt, kann das bullische Signal falsch sein.
- Betrachten Sie die Dauer des Abwärtstrends. Je länger er ist, desto genauer ist das Mustersignal.
Zusätzlich können Sie automatische Programme wie die besten Forex-Roboter verwenden. Sie können zusätzliche Bestätigung eines neuen Trends liefern und Trades eigenständig ausführen. Expertenberater können nicht mit professionellen Händlern konkurrieren, aber sie sind gute Assistenten für Anfänger.
Handelsstrategien mit Hammerkerzen
Jede Strategie ist individuell und hat viele Details. Es ist jedoch offensichtlich, dass das Handeln mit dem Hammerkerzenmuster darauf abzielt, Umkehrungen zu finden und Long-Positionen möglichst nahe am Beginn des Trends zu eröffnen. Damit die Strategie erfolgreich ist, ist es wichtig, die folgenden Parameter zu bestimmen.
- Ihr Risikotoleranzniveau. Es bestimmt, wie früh Sie bereit sind, in den Markt einzusteigen.
- Zeitrahmen. Das Hammer-Aktienmuster oder FX-Muster ermöglicht es Ihnen, sowohl auf intraday-Perioden als auch über mehrere Tage zu handeln.
- Zusätzliche Indikatoren. Sie können mehrere beliebte Umkehrindikatoren auswählen.
- Das Ziel. Ihre Ziele bestimmen, wie aktiv Sie handeln werden.
Die Hammerkerzen sind relativ einfache Muster und ermöglichen es Ihnen, relativ schnell mit dem Handel zu beginnen und Erfahrungen zu sammeln, um Ihre Strategie zu verbessern.
Unterschied zwischen Hammer und Doji
Doji, wie die tägliche Hammerkerze, deutet auf die Unsicherheit der Marktteilnehmer und eine mögliche Trendumkehr hin. Es gibt jedoch auch einige Unterschiede:
- Doji hat normalerweise einen "Nullkörper". Das heißt, der Schlusskurs ist gleich dem Eröffnungskurs.
- Doji hat zwei Dochte, der Hammer hat nur einen.
- Das Doji-Muster kann sowohl in einem bärischen als auch in einem bullischen Trend auftreten.
Doji ist eines der einprägsamsten Muster und es ist einfach, es im Chart zu finden.
Einschränkungen und Schwierigkeiten von Hammerkerzenmustern im Handel
Oben haben wir erwähnt, dass, wenn ein Hammer-Forex erscheint, Sie nicht sofort in den Markt eintreten sollten. Das Muster gibt ein ziemlich starkes Signal, hat aber auch mehrere Einschränkungen:
- Manchmal deutet das Muster nicht auf den Kaufdruck hin, sondern auf eine Korrektur der Verkäufer am Ende des Tages. So können die Verkäufer zu Beginn des nächsten Tages weiterhin den Preis nach unten drücken. Der Hammer befindet sich nicht immer am Ende eines Trends, und sehr oft setzt sich der bärische Trend fort. Es ist besser, zusätzliche Indikatoren zu verwenden, um die Umkehr zu bestätigen.
- Insgesamt ist das Muster ein guter Verbündeter der Forex-Händler, aber wie jedes andere Werkzeug sollte es nicht als 100%iger Handlungsaufforderung betrachtet werden.
Das Fazit
Das Hammer-Kerzenmuster hat eine einprägsame Form und signalisiert oft eine Trendumkehr. Natürlich lieben es Trader und integrieren es oft in ihre Strategien. Es erscheint, wenn Verkäufer nicht in der Lage sind, den Preis zu senken und dem Druck der Käufer widerstehen. Die Kerze ist leicht auf dem Chart zu erkennen und immer eindeutig. Gleichzeitig ist es wichtig zu verstehen, dass dieses Instrument eine Überprüfung und Bestätigung erfordert.