Das einfachste Werkzeug, das Preisbewegungen anzeigt, ist ein gleitender Durchschnitt. Abhängig von dem ausgewählten Zeitraum kann er glatter oder volatiler sein. MA ist tatsächlich eine Darstellung des Durchschnittspreises für einen bestimmten Zeitraum. Händler verwenden oft MA(20), MA(99) und mehr, um den Trend im Allgemeinen zu verstehen.
Auf der Grundlage dieser einfachen Kurven wurden viele andere Indikatoren und technische Analysewerkzeuge erfunden. Zwei solcher Werkzeuge sind das Golden Cross und das Death Cross. Diese Muster sind Schnittpunkte von zwei MA's und können den Händlern nützliche zusätzliche Informationen liefern. In diesem Artikel werden wir betrachten, wie man sie identifiziert und in Ihrer Handelsstrategie verwendet.
Was ist das Golden Cross?
Um das Forex-Muster des Golden Cross zu finden, werden kurzfristige und langfristige gleitende Durchschnitte verwendet. Am häufigsten sind dies MA(50) und MA(200). Der erste bezeichnet den Durchschnittspreis für 50 Tage und der zweite für 200 Tage. Das goldene Kreuz gilt als bullisches Signal und entsteht durch den Schnittpunkt von kurzfristigen und langfristigen gleitenden Durchschnitten. Dieser Prozess kann genauer in drei Phasen unterteilt werden:
- MA(50) liegt unter MA(200). Dieser Zeitraum ist durch einen Abwärtstrend gekennzeichnet.
- Der kurzfristige gleitende Durchschnitt nähert sich dem langfristigen und kreuzt ihn. Der Schnittpunkt kann als ungefährer Umkehrpunkt betrachtet werden.
- MA(50) steigt an und liegt über MA(200). Dies ist der Beginn eines bullischen Trends.
Das Prinzip des goldenen Kreuzes ist einfach: Wenn der kurzfristige gleitende Durchschnitt unter dem langfristigen liegt, ändert sich der Preis langsamer über einen kürzeren Zeitraum, und der Trend ist bärisch. Sobald jedoch MA(50) steigt, treten Änderungen am Markt auf, und es entsteht ein Trend für Preisanstiege. Zu diesem Zeitpunkt kann das goldene Kreuz auf dem Chart gesehen werden.
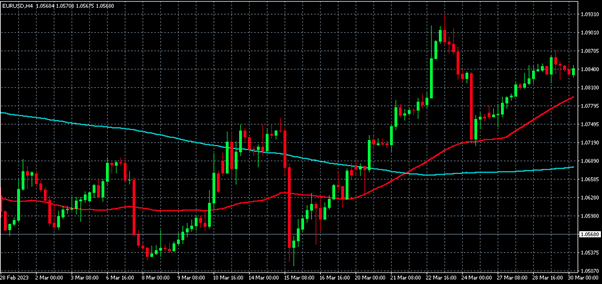
Die Abbildung unten zeigt den Chart des Währungspaares EUR/USD im H4-Zeitrahmen. Der kurzfristige gleitende Durchschnitt ist in Rot dargestellt, der langfristige in Blau. Es ist zu sehen, dass in den ersten zwei Dritteln des Charts die Preisschwankungen unbedeutend sind und grob dem Konzept des "Flat" entsprechen. Nach dem Schnittpunkt von MA(50) und MA(200) beginnt der Preischart jedoch schnell nach oben zu steigen.
Was ist der Death Cross?
Der Death Cross im Devisenhandel entsteht ebenfalls aus zwei gleitenden Durchschnitten. Hier sind jedoch ihre Richtungen entgegengesetzt zu dem, was wir auf dem Golden-Cross-Chart beobachtet haben. Der kurzfristige gleitende Durchschnitt kreuzt den langfristigen von oben nach unten. Dies wird als bärisches Signal betrachtet. Auch bei der Bildung des Death Cross können drei Phasen unterschieden werden:
- Vor dem Schnittpunkt. Der kurzfristige MA liegt über dem langfristigen MA. Zu dieser Zeit sieht der Markt in der Regel einen Aufwärtstrend.
- Die gleitenden Durchschnitte kreuzen sich, und der Trend ändert sich.
- Der kurzfristige MA fällt unter den langfristigen. Zu diesem Zeitpunkt bildet sich ein Abwärtstrend.
Die 50-Tage- und 200-Tage-Gleitenden Durchschnitte werden auch am häufigsten verwendet, um dieses Muster zu konstruieren. Es können jedoch auch andere Zeitrahmen verwendet werden. Der Death Cross hat seinen Namen, weil er einen Marktrückgang und einen massiven Verkauf von Vermögenswerten symbolisiert.
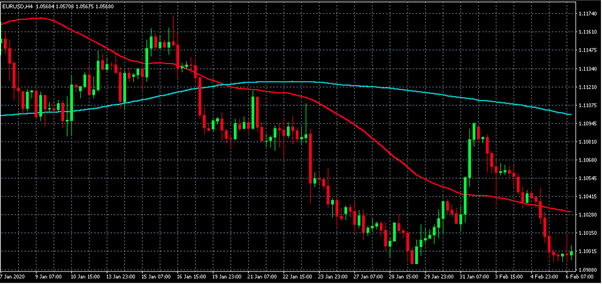
Das Bild unten zeigt einen weiteren Ausschnitt des EUR/USD-Charts. Der blaue MA(200) kreuzt den kurzfristigen roten MA(50) von unten nach oben. Der Preis bleibt eine Weile unverändert und fällt dann. Trotz eines kleinen Preishöhepunkts auf der rechten Seite des Charts setzte sich der Fall weiter fort. In diesem Beispiel gab der Death Cross also eine genaue Prognose ab.
Wichtige Unterschiede zwischen Golden Cross und Death Cross
Die Muster des Golden Cross vs. Death Cross sind einfach zu zeichnen und zu interpretieren. Das erste ist ein bullishes Signal, das zweite ein bärisches Signal. Zur Vereinfachung stellen wir die Hauptunterschiede zwischen den Mustern in einer Tabelle dar.
| Golden Cross | Death Cross |
|---|---|
| Signal für eine Long-Position | Signal für eine Short-Position |
| Kurzfristiger gleitender Durchschnitt kreuzt langfristigen von unten nach oben | Kurzfristiger gleitender Durchschnitt kreuzt langfristigen von oben nach unten |
| Es gibt einen Abwärtstrend vor dem Golden Cross | Ein Aufwärtstrend wird vor dem Death Cross beobachtet |
Die Zuverlässigkeit dieser Muster nimmt mit dem Maßstab zu. Deshalb werden gleitende Durchschnitte mit solch großen Perioden verwendet. Aufgrund des hohen Handelsvolumens können der Golden Cross und der Death Cross als ziemlich zuverlässige Indikatoren betrachtet werden.
Wie man die Muster des Golden Cross und Death Cross im Forex-Handel verwendet
Wie jeder andere technische Indikator können das Death Cross vs. Golden Cross-Paar auf unterschiedliche Weise in Ihre Handelsstrategie einbezogen werden. Obwohl die Signale recht eindeutig sind, können die Ansätze verschiedener Trader in Details abweichen.
Hier sind praktische Tipps, um Ihnen zu helfen, das Muster effektiver zu nutzen. Denken Sie jedoch daran, dass sie kein Aktionsleitfaden sind, sondern nur mögliche Optionen:
- Warten Sie auf das Auftreten eines neuen Trends, nachdem das Kreuz im Diagramm erscheint. Öffnen Sie dann eine Position.
- Verwenden Sie das Kreuz zusammen mit anderen Indikatoren oder zur Bestätigung anderer Indikatoren.
- Ein Zeitrahmen kann ein goldenes Kreuz zeigen, ein anderer ein Todeskreuz. Betrachten Sie das Diagramm auf verschiedenen Skalen.
- Verwenden Sie Volumenindikatoren, um das Signal zu bestätigen. Eine Volumenänderung kann eine Trendänderung begleiten.
- Beliebte Tools, die gut mit Kreuzen funktionieren, sind MACD und RSI.
- Denken Sie daran, dass gleitende Durchschnitte nachlaufende Indikatoren sind, daher sind Kreuze keine Prognose, sondern eine Bestätigung eines neuen Trends.
Es ist auch wichtig zu bedenken, dass jeder Indikator in verschiedenen Strategien unterschiedlich funktioniert. Zum Beispiel werden das Golden Cross und das Death Cross beim Scalping nicht effektiv sein. Nutzen Sie Ihre Beobachtungen und passen Sie die Tools an Ihre Strategie an.
Das Fazit
Heutzutage kennen Trader Dutzende von Haupt- und Hunderten von Nebenwerkzeugen der technischen Analyse. Alle haben unterschiedliche Grade an Komplexität und Zuverlässigkeit. Dieser Artikel hat einfache und ziemlich zuverlässige Muster überprüft: das Golden Cross und das Death Cross. Es handelt sich um Schnittpunkte von zwei gleitenden Durchschnitten und geben klare Kauf- oder Verkaufssignale.
Kreuze ermöglichen es Ihnen, den Trendumkehrpunkt genauer zu bestimmen und rechtzeitig eine Position zu eröffnen. Es ist auch wichtig zu beachten, dass Sie bei einem Übermaß an technischen Informationen die Analyse von gleitenden Durchschnitten, Kreuzen, zahlreichen Oszillatoren und Indikatoren elektronischen Assistenten überlassen können. Zum Beispiel analysieren die besten Forex-Roboter eine riesige Menge an Daten, um den Tradern bei der genauen Entscheidungsfindung zu helfen. Trotzdem sollte ein erfahrener Trader trotz intelligenter Tools wissen, was ein Death Cross und ein Golden Cross sind.