Trader verwenden Dutzende von technischen Analysetools, um auf dem Forex-Markt erfolgreich zu sein. Einige bewerten die Situation unabhängig, indem sie den Preischart und zusätzliche Indikatoren studieren. Andere benötigen Hilfe, um mit der Fülle technischer Informationen zurechtzukommen und die besten Forex-Roboter zu verbinden, die fertige Lösungen anbieten oder eigenständig handeln.
In jedem Fall sind Indikatoren entscheidend. Sie helfen dabei, die Trendrichtung und -stärke zu bestimmen. Während sich die meisten Anfänger auf Kauf- und Verkaufssignale konzentrieren, versuchen erfahrene Trader zu verstehen, wie stark und nachhaltig der aufkommende Trend ist. Der Average Directional Index (ADX) kann ihnen dabei helfen. Im Folgenden werden wir besprechen, wie Sie den durchschnittlichen Richtungsindex in Ihre Strategie einbeziehen und wie Sie ihn berechnen können.
Verständnis des Average Directional Index (ADX)
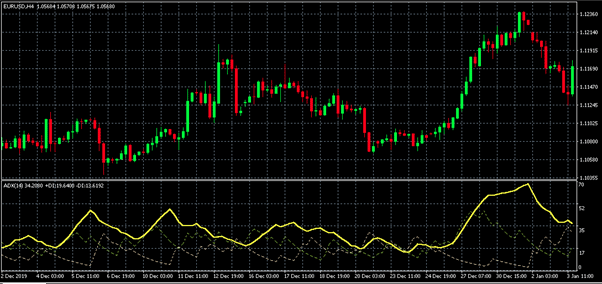
Was ist der durchschnittliche Richtungsindex? Es handelt sich um ein nützliches technisches Werkzeug, das vom berühmten Finanzanalysten Welles Wilder in den 1970er Jahren entwickelt wurde. Der Indikator funktioniert unabhängig von der Marktrichtung und zeigt die Stabilität des Trends an. Er nimmt Werte von 0 bis 100 an. Je höher der Wert, desto stärker der Trend. Bei der Interpretation sollten Sie überprüfen, ob der Preis steigt oder fällt, da der ADX in einer Seitwärtsbewegung nicht zuverlässig funktioniert.
Wir sollten dieses ADX Forex-Indikator-Tutorial mit Informationen darüber beginnen, wie er auf den Charts angezeigt wird. Der Index besteht normalerweise aus drei Linien, die in MT4, MT5 und anderen Plattformen aktiviert werden können. Neben dem ADX selbst werden ein negativer Richtungsindikator (-DI) und ein positiver Richtungsindikator (+DI) angezeigt. Mithilfe dieser zusätzlichen Kurven können Sie die Stärke des Trends und seine Richtung herausfinden. Obwohl die Berechnung des Index recht komplex ist, ist er im realen Handel einfach anzuwenden.
Durchschnittliche Richtungsindexberechnung
Es ist praktisch, den Durchschnittlichen Richtungsbewegungsindex in Excel zu berechnen, da die Berechnung die Verwendung von Daten aus mehreren Perioden (normalerweise 14) erfordert. Im Folgenden finden Sie einen Schritt-für-Schritt-Plan und die endgültige Formel für den durchschnittlichen Richtungsindex. Die Informationen dienen der Vertrautmachung und einem besseren Verständnis, wie ADX funktioniert. In der Praxis macht das Handelsprogramm automatisch Berechnungen und zeichnet ein Diagramm. Hier ist also der schrittweise Algorithmus:
1. Berechnen Sie +DM (Richtungsbewegung) und -DM für den Berechnungszeitraum (Wilder empfahl, 14 Intervalle zu verwenden) mit den Formeln:
+ DM = aktuelles Kerzenhoch - vorheriges Kerzenhoch
- DM = vorheriges Kerzenhoch - aktuelles Kerzentief
Der größte Wert wird für weitere Berechnungen verwendet.
2. Berechnen Sie das wahre Intervall mit einer der Formeln:
TR = aktuelles Kerzenhoch - aktuelles Kerzentief
TR = aktuelles Kerzenhoch - und vorheriger Kerzenschluss
TR = aktuelles Kerzentief - vorheriger Kerzenschluss
Verwenden Sie den größten Wert in den Berechnungen.
3. Berechnen Sie die Durchschnittswerte von +DM, -DM und TP für 14 Perioden.
4. Berechnen Sie +DI und -DI mit den Formeln:
+DI = ((Glatte+DM)/ATR)*100
-DI = ((Glatte-DM)/ATR)*100
wobei ATR die durchschnittliche wahre Spanne ist.
Finden Sie den Richtungsindex (DI) mit der Formel:
DI = ((+DI - -DI)/(+DI + -DI))*100
5. Berechnen Sie den durchschnittlichen Richtungsindexindikator für 14 Perioden mit der Formel:
ADX = ((Vorheriger ADX * 13) + Aktueller ADX)/14
Als Ergebnis dieser komplexen Operationen erhalten Sie eine Kurve, die die Stärke des aktuellen Trends ziemlich genau darstellt.
Verwendung von ADX in Handelsstrategien
Trotz der Einfachheit seiner visuellen Darstellung enthält der ADX-Indikator viele Informationen. So kann die Hauptlinie zur Bestimmung der Trendstärke verwendet werden, und die Hilfslinien - für mögliche Umkehrungen. All diese Daten können erfolgreich in Ihre durchschnittliche Richtungsindexstrategie eingebunden und mit anderen Methoden verwendet werden.
Die Stärke des Trends zeigt den besten Zeitpunkt zum Öffnen oder Schließen eines Geschäfts an. Es zeigt das Verhältnis des Verkaufsvolumens zum Kaufvolumen und gibt ein allgemeines Verständnis für das Vertrauen der Marktteilnehmer. Bei ungefährer Parität zwischen Verkäufern und Käufern sehen wir eine Seitwärtsbewegung im Chart, und die ADX-Kurve neigt gegen Null. Und umgekehrt steigt der ADX-Chart, wenn das Gleichgewicht sich zu Bullen oder Bären verschiebt.
Um den ADX Average Directional Index in Ihrer Handelsstrategie zu verwenden, sollten Sie seine Werte korrekt interpretieren. Unten sind ungefähre Bereiche und ihre Bedeutungen aufgeführt:
- Bis zu 20%. Der Bereich zwischen Widerstands- und Unterstützungsebenen ist gering. Der Preis ändert sich fast nicht. Zu diesem Zeitpunkt ist es am besten, zu beobachten und auf zusätzliche Bestätigungen zu warten.
- Von 20% bis 30%. Es ist zu früh, um in diesem Stadium eine Position zu eröffnen, aber es gibt eine Tendenz, dass ein starker Trend entsteht. Es macht Sinn, hier +DI und -DI zu überprüfen, um Informationen über die Richtung zu haben.
- Von 30% bis 40%. Selbstbewusste Bestätigung des Trends. Dies ist ein günstiger Moment, um eine Position zu eröffnen.
- Von 40% bis 50%. Die durchschnittliche Richtungsindexbedeutung dieses Wertes ist am klarsten. Der Trend hat hier das größte Momentum.
- Mehr als 50%. In diesem Bereich kann der Trend nachlassen und die Richtung ändern. Es ist wichtig, andere Indikatoren zu analysieren und auf Umkehrsignale zu warten.
Der ADX-Indikator im Forex gibt manchmal falsche Signale, insbesondere auf kleinen Zeitskalen, aber im Allgemeinen ist er sehr genau. Es ist auch nützlich zu berücksichtigen, welche Signale über die Trendrichtung von +DI und -DI gegeben werden:
- +DI kreuzt -DI von unten nach oben und setzt seinen Aufwärtstrend fort. Dies ist ein bullishes Trendsignal.
- +DI kreuzt -DI von oben nach unten und setzt seinen Abwärtstrend fort. Dies ist ein bärisches Trendsignal. Die maximale Divergenz der beiden Kurven bedeutet einen starken Trend. Hier ist eine Preiserholung sehr wahrscheinlich.
Wenn Sie diese Daten in Ihrer Arbeit verwenden, erhalten Sie ein zusätzliches Werkzeug, das Ihnen helfen wird, ausgewogenere und genauere Entscheidungen zu treffen.
Einschränkungen bei der Verwendung des ADX
Wenn Sie wissen, wie man den durchschnittlichen Richtungsindex im Forex berechnet, reicht dies immer noch nicht für eine ordnungsgemäße Implementierung aus. Um ihn profitabel zu nutzen, müssen Sie alle möglichen Einschränkungen verstehen. Diese können sich sowohl auf die ADX-Linie als auch auf die DI-Linien beziehen.
Die Situation, in der +DI und -DI nahe beieinander liegen oder sich schneiden, bedeutet ein ungefähres Marktgleichgewicht. Der Markt kann für eine ziemlich lange Zeit in diesem Zustand verharren, und daher können häufige Schnittpunkte irreführend sein. Es ist wichtig, auf eine größere Divergenz zu warten, damit sie zur Grundlage Ihrer Entscheidung werden kann.
Dies gilt auch für den Indikatorwert. Wenn der durchschnittliche Richtungsbewegungsindex im Forex über 20% gestiegen ist oder sogar 30% erreicht hat, handelt es sich noch nicht um ein 100%iges Signal, um eine Position zu eröffnen. Die Kurve kann genauso schnell fallen und in die Flachzone zurückkehren. Sie können Ihre Hypothesen mit anderen Indikatoren testen, um nicht zu früh in den Markt einzusteigen.
ADX im Forex-Handel: Praktische Tipps
Um zu lernen, wie man den durchschnittlichen Richtungsindex verwendet und das Beste daraus macht, können Sie die folgenden Expertentipps verwenden:
- Achten Sie nicht auf den ADX, wenn der Preischart flach ist. Während dieser Zeit kann der Indikator falsche Signale geben.
- Der Beginn des Trends liegt in der Zone von 20% bis 30%. Betreten Sie den Markt, wenn der ADX das Ende dieses Bereichs erreicht.
- Für verschiedene Währungspaare können sich die Bereiche geringfügig unterscheiden, daher ist es wichtig, eigene Beobachtungen anzustellen.
- Verwenden Sie keine Zeiträume unter H1.
Indem Sie diesen Tipps folgen und einen ADX-Indikator für Forex mit anderen Tools kombinieren, können Sie effektivere und profitablere Geschäfte tätigen.
Das Fazit
Der ADX Forex-Index kombiniert zwei Schlüsselfunktionen. Er zeigt die Stärke des Trends und seine zusätzlichen Linien liefern Informationen über mögliche Umkehrungen. Der Indikator hat eine recht komplexe Formel, wird aber automatisch auf allen Handelsplattformen berechnet. Bei Verwendung können Sie Trades eingehen und den Markt zum richtigen Zeitpunkt verlassen. Natürlich sollten Sie sich an mögliche falsche Signale erinnern und die ADX Forex-Handelsstrategie nur in Kombination mit anderen Tools verwenden.