DeMarker Indicator: Strategies, Insights, and Practical Applications

Like other indicators in technical analysis, the DeMarker technical indicator (DeM) is designed to identify optimal entry and exit points in the market. It works by determining overbought and oversold zones. The DeMarker indicator explained by Tom DeMark was named after its inventor.

What Is DeMarker Indicator?

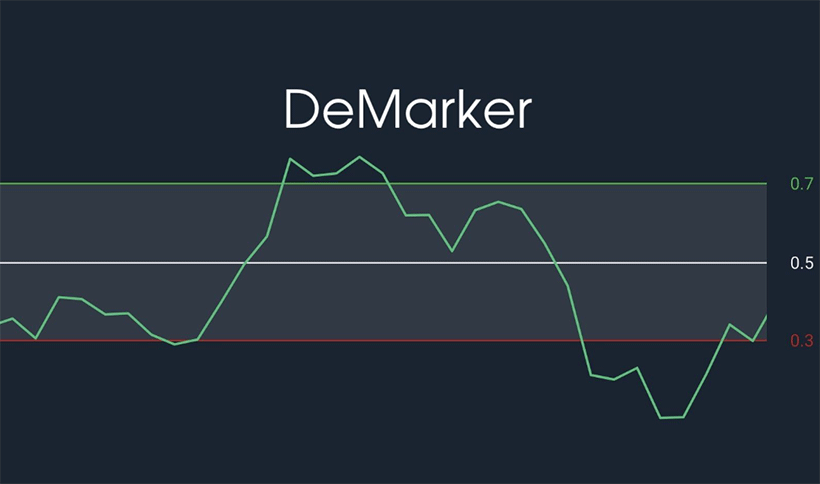
The DeMarker oscillator ranges from 0 to 1. Within this range, it evaluates the supply and demand of a certain asset, also taking into account the changes in the maximum and minimum price over a selected user-defined timeframe.

How Does the DeMarker Indicator Work?

DeMarker Indicator: Strategies, Insights, and Practical Applications - img 01

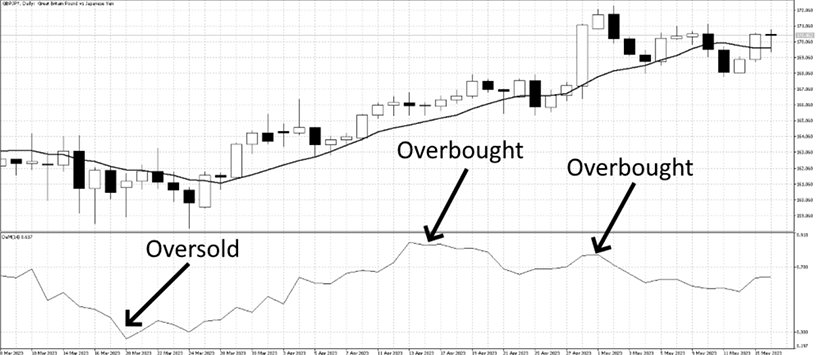
It analyzes all the listed data and reports whether the asset is currently overbought or oversold. Accordingly, when an asset (e.g., the price of a currency pair) approaches the overbought or oversold zone, it signals a potential trend reversal. That is, if the demand for a currency pair is excessively high compared to other periods, it’s likely to decrease.

How to use the DeMarker indicator? A trader or the best Forex robots, which can also use this tool, notice moments when the price is too high or too low. They make decisions about entering or exiting a position based on this. It’s also crucial for spotting market reversals and finding moments of consolidation.

Calculation of the DeMarker Indicator

When calculating the DeMarker indicator Forex, the formula compares the current price action with the previous one over a chosen period. The difference between the current and previous price highs is determined. If they are the same, the indicator DeMarker equals zero. Typically, a 14-period timeframe is chosen for calculations. The next step is to divide the sum of the current highs by the sum of highs and lows for these periods.

In simple terms, the calculation is performed using the following formula:

DeMarker Indicator formula

In this formula, DeM represents your DeMarker indicator. The abbreviation SMA stands for Simple Moving Average. Accordingly, Max and Min are the highs and lows of the asset’s price in the chosen timeframe.

This formula, i.e., the DeM indicator, aims to show how the supply and demand for a given asset are changing over the timeframe needed for analysis. Based on these indicators, conclusions can be drawn about the trend’s future movement: whether it will reverse, enter a plateau, or continue upwards or downwards, depending on the situation.

Interpretation of the DeMarker Indicator

Let’s move on to the most important part — how to use DeMarker indicator, meaning how to interpret the numbers obtained through the formula. It should be noted that the indicator is calculated automatically. You get a number between 0 and 1, and there’s no need to apply the formula every time. However, it’s crucial to understand why you should react to these values in a particular way.

So, how to use the DeMarker indicator in practice? When you see that the DeMarker indicator has a value above 0.7, the market is overbought. In this situation, prices will likely start to drop soon. If you’re holding a position hoping that the asset’s price will continue to rise, it’s time to exit, as the price is likely to fall. It’s logical to exit the position before this happens to lock in the maximum possible profit.

When the De Marker indicator has a value below 0.3, the market is oversold. You might think that the price will continue to fall and it’s better to wait before buying, but now is the time — the price will only increase from this point. If you want to profit from this, you should buy while the market is still oversold. Values between 0.3 and 0.7 are considered neutral. Price fluctuations occur but are not significant. Profiting from this can only be done using short-term trading strategies, such as scalping.

These values can be used as hints, but traders never rely solely on the results of one indicator, on the DeMarker meaning, for instance. They cross-reference and compare several signals to make a final decision. This is also the best DeMarker strategy.

Using the DeMarker Indicator in Trading

To use the DeMarker indicator, you need to add it to your timeframe and conduct the analysis. If you’re using trading robots, the indicator should be added to the rules and settings for your expert advisor. Accordingly, in oversold zones (below 0.3), it’s worth buying, in overbought zones (above 0.7), it’s worth selling, and in the neutral zone (0.3-0.7), you should act based on your primary strategy. Usually, this is the time to wait to understand where the market will move next.

How to Use DeM Alongside Other Technical Indicators

It’s a great idea to combine signals from the DeMarker indicator with the results of other indicators. This will give you a complete picture of what is happening in the market. Traders typically try to complement one indicator with others that don’t duplicate but enhance the information. In the case of the DeMarker indicator, it’s best combined with the following tools: Combine DeMarker forex with MACD when looking for trend reversal confirmation. When both tools signal overbought or oversold conditions, you can trust this information. Use RSI — another oscillator that, in combination with the DeMarker indicator, allows for a more accurate interpretation of the current market situation, leading to well-informed and justified decisions.

DeMarker Indicator: Trading Strategies

DeMarker Indicator: Strategies, Insights, and Practical Applications - img 02

The main DeMarker indicator strategy is to look for trend reversal points when the price begins to move sharply upward or downward. You should focus maximum attention on the overbought and oversold zones to spot a trend reversal point. The DeMarker indicator can also be used for breakout trading. These are points when the market is still consolidated but approaching overbought or oversold lines, after which the price can sharply bounce up or down.

DeMarker Indicator Advantages and Limitations

Using the DeMarker indicator is simple, making it a tool well-suited for beginners and professionals. It provides clear signals about when to buy and when to sell, and it’s easy to interpret. Moreover, it’s a tool applicable to different asset types.

Pitfalls: potential errors and lack of information about trend strength. To overcome these shortcomings, traders should use the DeMarker only alongside other technical analysis tools to ensure the accuracy of results.

DeMarker Indicator: Practical Tips for Forex Traders

Working with the DeMarker is simple. While it’s necessary to understand complex chart patterns, here, you just need to focus on whether the market is overbought or oversold. However, to improve the accuracy of your technical analysis, follow these tips: Analyze across multiple timeframes for higher accuracy. Use additional tools to confirm signals in moments of strong trends or reversals. Also, verify your forecasts with the results of fundamental analysis: check the news and assess the global market situation. This approach will help avoid many risks, thus protecting against potential financial losses.

The Bottom Line

The DeMarker indicator will become your reliable assistant when you need to understand how the price will move next. Use this tool in combination with other technical analysis indicators, and it will allow you to make more accurate predictions, thereby increasing your profitability in Forex trading.