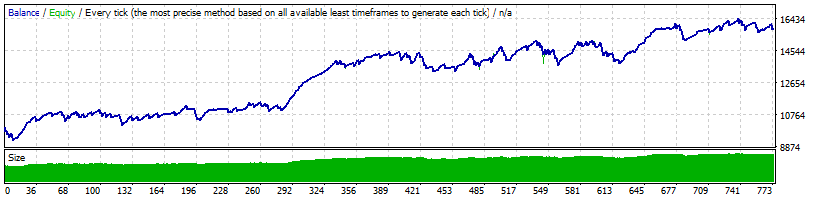
Strategy Tester Report
Forex ASIA Scalper
Tickmill-DemoUK (Build 1090)
| Symbol | USDJPY (US Dollar vs Japanese Yen) | ||||
| Period | 5 Minutes (M5) 2013.01.01 23:00 - 2018.07.24 23:55 (2013.01.01 - 2018.07.25) | ||||
| Model | Every tick (the most precise method based on all available least timeframes) | ||||
| Parameters | MagicNumber=654654; Auto_GMT=true; Calculate_DST=true; Manual_GMT_Offset=2; Auto_Risk=5; Lots=0.1; Slipage=1; Max_Spread=3; Stop_Loss=38; Take_Profit=24; Channel_Period=18; Exit_Distance=-9; Entry_Break=-2; Min_Volatility=16; Start_Trade_Hour=21; End_Trade_Hour=22; Exit_Profit_Pips=-6; Reverse_Profit=20; Exit_Minutes=190; Time_Profit_Pips=3; | ||||
| Bars in test | 411446 | Ticks modelled | 112651453 | Modelling quality | n/a |
| Mismatched charts errors | 856101 | ||||
| Initial deposit | 10000.00 | Spread | 10 | ||
| Total net profit | 5855.14 | Gross profit | 32750.03 | Gross loss | -26894.89 |
| Profit factor | 1.22 | Expected payoff | 7.58 | ||
| Absolute drawdown | 833.27 | Maximal drawdown | 1775.90 (11.62%) | Relative drawdown | 11.62% (1775.90) |
| Total trades | 772 | Short positions (won %) | 431 (72.16%) | Long positions (won %) | 341 (78.01%) |
| Profit trades (% of total) | 577 (74.74%) | Loss trades (% of total) | 195 (25.26%) | ||
| Largest | profit trade | 187.26 | loss trade | -302.64 | |
| Average | profit trade | 56.76 | loss trade | -137.92 | |
| Maximum | consecutive wins (profit in money) | 31 (1947.83) | consecutive losses (loss in money) | 4 (-616.93) | |
| Maximal | consecutive profit (count of wins) | 1947.83 (31) | consecutive loss (count of losses) | -772.13 (3) | |
| Average | consecutive wins | 4 | consecutive losses | 1 | |