交易是人類活動的一個特定領域。要取得成功,您需要擁有相當豐富的知識和技能,包括分析交易模式的能力。其中最常用的模型之一是 Shooting Star 蠟燭線。讓我們更仔細地看看它的特點以及它所指示的市場變化。
理解 Shooting Star 蠟燭線模式
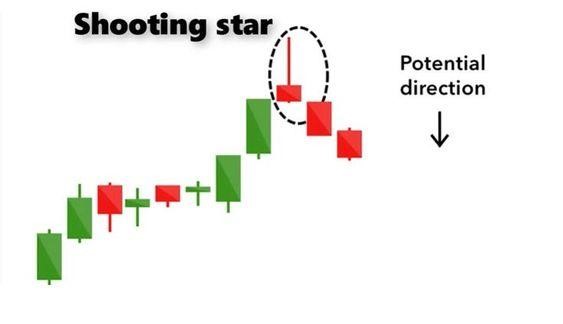
Shooting Star 蠟燭是一種價格模式。當資產價格上漲然後下跌時,就形成了這種模型。因此,在收盤時,價格與開盤時相同或接近。這種模式向交易者發出可能市場反轉和轉向熊市趨勢的信號。
Shooting Star 蠟燭線模式對交易者來說非常方便,具有以下優勢:
- 易於檢測;
- 簡單分析;
- 在研究市場趨勢方面的實用性。
如何識別 Shooting Star 模式?
Shooting Star 蠟燭線指示了市場上的一種情況,即資產價格在開盤後上漲然後下跌。因此,在交易結束時,資產的成本接近交易會話開始時的價值。
Shooting Star 圖表模式符合以下標準:
- 圖表高點顯著高於前一根蠟燭的收盤價;
- 蠟燭線的開盤價接近前一個圖表的收盤價;
- 該模式收盤價低於當前時期開始時形成的本地高點。
Shooting Star 蠟燭線的解剖
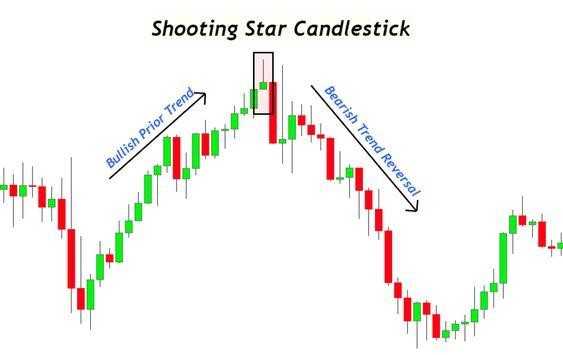
射星蜡烛看起来很特别。它有一个小身体和一个长的上影线,这意味着买盘压力,因此资产价格上涨。图表中的这部分应该至少比蜡烛身体的整个长度要大。
图表的下影线很短。这表明价格下跌。有时,射星蜡烛的阴影也被称为蜡烛芯或尾巴。有些模式没有下尾巴。不过,它们相当罕见。
射星蜡烛和倒置锤之间的区别
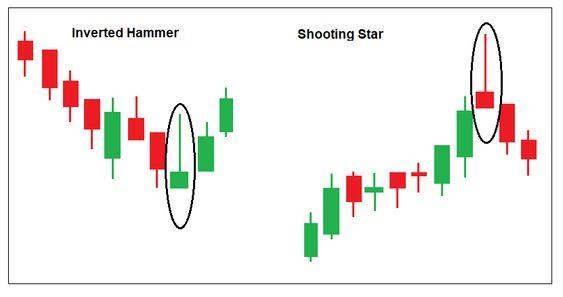
交易员使用许多蜡烛图案。其中一些以特定方式相互关联,如射星蜡烛和倒置锤。在分析这两种交易模式时,值得注意它们适用的背景。射星蜡烛图案出现在价格上涨趋势的末尾。它表明了趋势开始向下转变的迹象。至于倒置锤,它显示相反的趋势。当收盘价高于开盘价时形成该图案。买盘压力将其推高,这由长影线表示。
验证射星图案:补充指标和信号
有经验的交易员知道,射击之星蜡烛图表明市场开始进入熊市趋势,因此,价格应该预计会开始下降。然而,为了确保判断的正确性,值得分析射击之星之后出现的两三个连续蜡烛图案,并不要忘记使用其他指标。
历史数据也对更深入和准确的分析有所帮助。交易员能够处理的数据量越大,越好。然而,最佳外汇机器人在这方面将是最有效的。与人类相比,它们在数据分析方面的优势是显而易见的。这些程序将帮助更详细地调查市场情况。
射击之星图案的解释
要理解射击之星蜡烛图的含义,重要的是考虑以下几个方面。
- 注意市场开盘后价格上涨。这表明在前一增长期间存在的购买压力。买家数量越多,蜡烛图的尾巴就越长。
- 在第一阶段之后,您应该预期价格下跌。通常发生在下午,并且达到接近开盘价的收盘水平。这种变化是由卖家数量的增加引起的。他们将资产价格推到交易开盘时的水平。
- 接下来,为了进行最佳可能的分析,投资者需要确认趋势的逆转。为此,交易员经常分析射击之星后出现的蜡烛图案。只有当描述的模式之后的模式也反映出价格下跌时,才被认为是熊市趋势。
流星确认价格下跌,特别是如果遵循这种模式的图表表明相同的趋势。交易者考虑这样的选择,如做空或卖出。因此,流星蜡烛图案有助于更准确地预测未来市场趋势,并相应地做出正确的决策。
流星蜡烛图案告诉我们什么?
流星蜡烛图案由几个部分组成,其中最宽的部分显示价格之间的差异。上影线显示了价格如何从开盘到当天最高点上涨。下影线通常较短,显示了交易结束时价格的下跌。
要了解什么是流星蜡烛图案,还值得注意图表的颜色,这表明开盘价和收盘价之间的差异。有两种可能的颜色类型:绿色和红色。第一种选项显示收盘价高于开盘价。绿色的流星蜡烛表示市场中的熊市趋势。另一方面,红色的流星蜡烛是一个更强有力的信号,向交易者提供有关即将到来的熊市趋势的信息。
从流星图案中获得的见解
根据流星蜡烛图案,交易者意识到市场中的熊市趋势即将到来。但在第二天出现新模式之前,得出结论还为时过早。如果其他类型的流星蜡烛图案也表明价格下跌,投资者可以开始根据这些数据做出交易决策,例如,采取做空、出售资产等措施。
交易者應該注意圖案開盤時的活躍趨勢,以及下午出現的價格下跌。趨勢必須經過確認。為此,投資者使用蠟燭圖模式來觀察未來幾天的情況。
射星限制
外匯射星模式對交易者非常有用,但它也有缺點。有時,這種模式會產生虛假信號。因此,在制定交易策略時,最好使用幾個類似的圖表(例如,射星十字蠟燭圖將是有效的),並記住基本分析的重要性。通過這種方式,交易者將能夠做出更準確的預測並獲得更多利潤。
如何使用射星進行外匯交易:提示和最佳實踐
投資者在外匯市場使用射星來預測熊市趨勢並進行技術分析。賣家接管市場時,價格下跌,這必然會在圖表上得到體現。要在這種情況下成功交易,投資者應該專注於以下行動:
- 尋找進場點;
- 確定目標利潤;
- 積極使用止損。
總結
射星是由市場中的多頭行為形成的。在交易開始時,牛市活躍,導致價格上漲。然而,在交易結束時,熊市掌握了主動權。結果,資產價格下跌至先前水平。外匯交易中的射星表明,多頭對資產的興趣已經枯竭,交易者應該預期市場情緒的變化和趨勢的逆轉。
模式的有效性取决于交易者如何使用这个图表。他们能够更好地分析它们,投资策略就能更成功。为了做到这一点,值得研究至少两三个遵循 Shooting Star 形态的蜡烛图案。