Reliable Forex trend reversal signals allow traders to maximize their profits. Knowing about trend reversals before others helps you swiftly react to changing market sentiments. This could be closing orders to protect your assets or opening them to profit from the trade.
One of such popular signals that predict a trend reversal is the inverted hammer. It warns traders that the price of an asset is on the step to going up. This means it will be profitable for you to buy a currency at a lower price now to sell it at a higher price later. But do not rush to implement a trading strategy based on the inverted hammer candlestick only. First, learn how to distinguish it from false signals and avoid pitfalls that inexperienced traders encounter.
What Is an Inverted Hammer Candlestick?
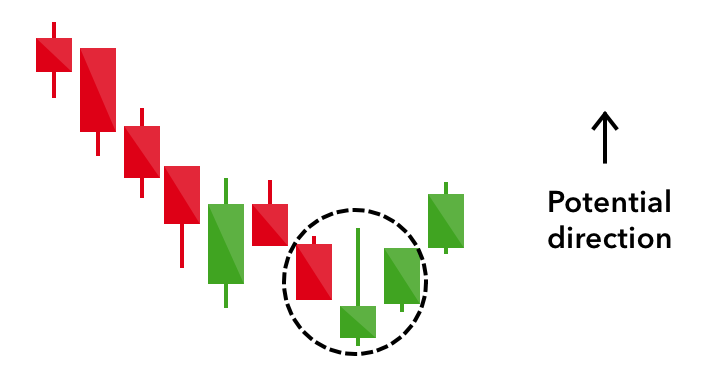
An inverted hammer candlestick pattern is a single candle that appears at the bottom of an asset's price trajectory. It closes a downtrend by drawing a line under a falling currency price. It signals traders that buyers have begun to show more interest in the asset, meaning its price will start to rise from the next trading session.
However, although this pattern consists of a single candle, a trader should wait for a confirmation signal. It can be in the form of a bullish candle or a small gap up between this candle and the next one. It shows that the opening or closing of the trading session the following day is above the body of the inverted hammer.
Emotions can hinder trader and push them to mistake wishful thinking for profitable possibilities. But if you rely on the best Forex robots, such a situation will be excluded. The robots are trained to act only when they receive reliable confirmation signals.
How to Identify an Inverted Hammer Candlestick?
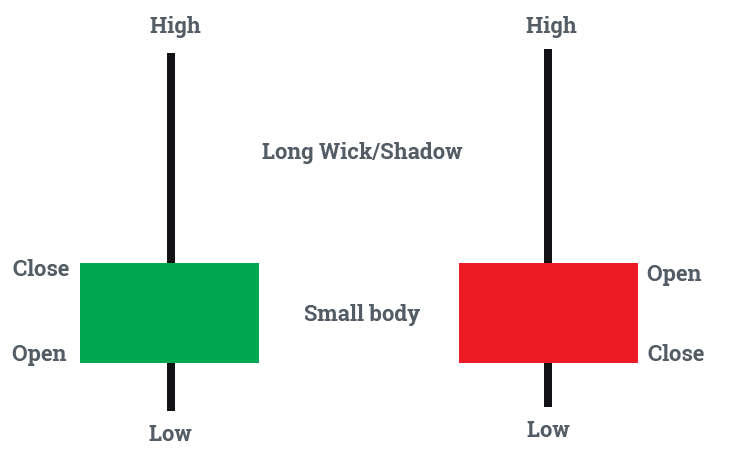
An inverted hammer candle gets its name from the visual resemblance to a hammer with its head facing down. The following parts must be present in this candlestick to call it an inverse hammer:
- Long upper wick, which resembles the handle of the hammer;
- The short body of the candlestick or the head of the hammer;
- Short lower wick.
This pattern signals that the price of the asset has reached its minimum, and the potential for a reversal and an uptrend has accumulated.
You can understand the inverted hammer meaning by the following elements of the candlestick:
- A short body indicates that the difference between the opening and closing quotes was small.
- A long upper shadow indicates that the asset value increased significantly during the trading period.
- A short lower shadow indicates that the asset value decreased slightly relative to the opening price during the trading period.
Taken together, this means the price of the asset stopped falling and reached a new high during this trading session. However, at the moment of closing the trading session, the difference between the opening and closing prices was not significant.
An inverted hammer bullish or bearish nature may create some confusion. If such a pattern appears at the top of a price move after a prolonged uptrend, it signals the oncoming of a bearish trend. The asset price has reached a maximum and will begin to move down. However, an upside-down hammer candle at the top of a chart has another name ― Shooting Star.
Significance of Inverted Hammer in Forex Trading
An inverted hammer pattern is a helpful indicator that assists a trader in making correct forecasts. It is relevant for all markets, not just Forex. Learn to recognize it, trust it, and test it when trading currencies. Then, you can easily rely on it when trading crypto, stocks, commodities, and other assets.
If you use this signal to spot the beginning of a new trend, you can quickly pick it up and make a significant profit. Its advantage is that it is easily discernible by trading pros and beginners. Therefore, it is easy to work with and integrate it into your trading strategies.
Trading Strategies Using the Inverted Hammer
The upside down hammer candlestick is a reversal pattern. This means you will be opening positions against the current trend. Of course, this implies a certain risk. But when you learn all the nuances of using this signal in trading strategies, this risk will be minimal.
Confirming the Signal
The reverse hammer candlestick signals the trader that a trend reversal is coming. However, it may not happen for some reason. For example, some sudden events in politics will happen, or the government report for the last quarter will be published the next day. They may cool the mood of buyers. In this case, the inverse hammer will act as a false signal. Therefore, experienced traders warn that this is not a signal to buy but an indicator of potential price change. To go long, you need to wait for a confirming signal:
- Breakthrough of downward trendline resistance;
- Appearance of Gap Up on the next trading day;
- A bullish green candle at the end of the next day.
Entry and Exit Points
The entry point for a long position depends on the trading approach you follow:
- With an aggressive approach, you can enter a long position as soon as you see a Gap Up for the next candle.
- If you follow a conservative approach, wait for the next candle to close. If it is higher than the previous candle, you can open a long position.
- When opening a long position, remember to set a Stop Loss just below the lower shadow of the inverted hammer. In this case, if the trend does not reverse, you will minimize your losses.
If the inverted green hammer does not receive a confirmation signal, you can open a short position, i.e. sell the currency.
Combining with Other Indicators
Traders have different opinions on whether the inverted red hammer and green hammer are strong signals. Those who believe in its power act more aggressively after its detection. Conservatives prefer to combine it with other indicators. Here are some alternatives you can use with the Forex inverted hammer:
- Look at the Moving Averages. If the inverted hammer candlestick is located below the key moving averages on the chart, this confirms a trend reversal signal.
- Analyze the trading volume. If it has increased, this confirms buyers' interest in the asset.
- Evaluate the momentum indicators RSI or MACD. If they show the asset is oversold, this means a reversal is imminent.
Common Pitfalls and How to Avoid Them
- The profitability of the inverted hammer candle cannot be fully guaranteed due to false signals. So, remember to check this pattern with other indicators. And set a Stop Loss, since you will be opening a position against the current trend.
- Clear entry or exit points are difficult to determine by relying only on the inverted hammer candlestick pattern. To find these points, use oscillators, trendlines, and other indicators.
- The appearance of the upside down hammer candle on the price chart depends on the timeframe you have chosen. Therefore, if you are experimenting with different timeframes, do not rely only on the inverted hammer but look for confirmation of your conclusions.
- If the market is highly volatile, the potential for a trend reversal may not materialize because the next news from the world of politics or economics will knock the buyers' willingness to pay more. So, in highly volatile markets, wait for a buy signal, not just a potential market reversal.
- A trader's subjective interpretation of the pattern may be incorrect. To avoid this problem, you can use Forex robots. Their advanced algorithms accurately identify Japanese candlestick patterns and allow traders to avoid mistakes.
Conclusion
The inverted hammer pattern is a popular indicator in technical analysis due to its simplicity and effectiveness. It is easily noticeable visually, so it attracts the attention of the trader. It signals that the downward trend in price movement has exhausted itself.
If the asset is oversold and buyers begin to show more interest in this currency, the closing and opening prices of the trading session are located close. Therefore, they form a short body of the candle. The lower shadow is short since the price did not fall significantly. On the contrary, the upper shadow is long. This indicates that the value of the asset increased significantly during the day. Such a pattern sends a signal that this may not be accidental. And if at the beginning of the next trading session or its end, you receive a confirmation signal, you can open a long position.