由於W底部模式是許多交易者喜歡的模式之一,讓我們深入研究這個主題。在外匯市場中,雙底意味著什麼?您如何利用這種模式獲利,有哪些技巧可以使用?
首先,我們要說的是,這種模式發生在長期下跌後,可以作為識別市場上升時的買入機會的手段。雙底模式得名於在重要支撐水平形成的兩個底部。這種模式很明顯,因為它表明市場水平上需求超過供應,並且不僅僅是一次,而是在相對短的時間內兩次。
雙底:是什麼?
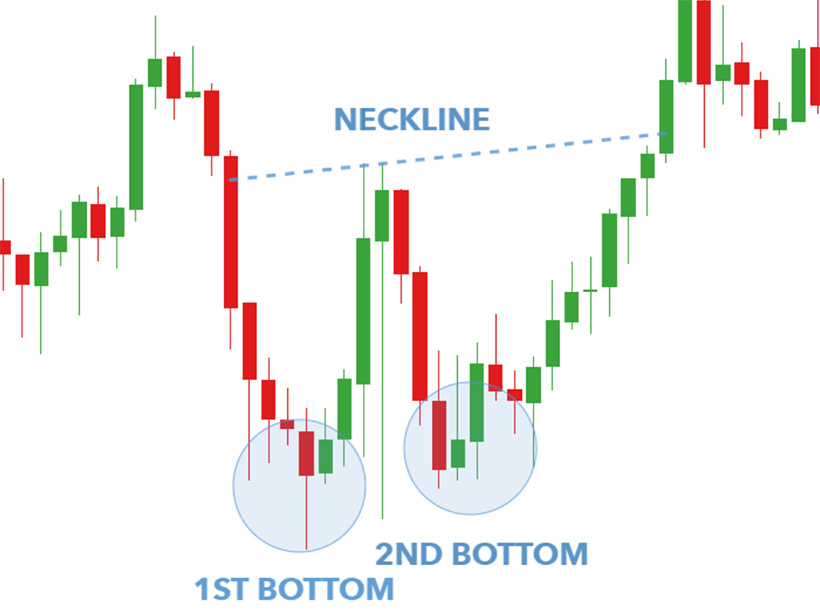
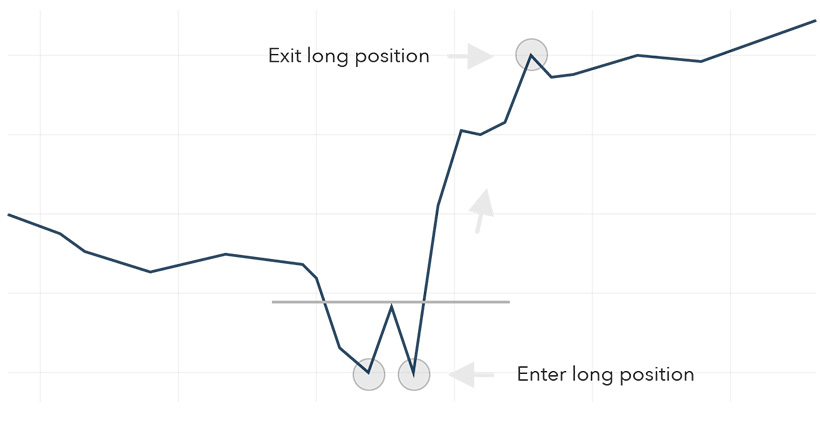
雙底是一種技術圖表模式,涉及在相似的水平價格水準形成兩個低點,表明潛在的看漲逆轉信號。價格通常在低點處顯示一些支撐,導致在兩個最低點之間進行量度的整理。
這種模式通常在一個下跌趨勢結束時觀察到,並且在圖表上類似於字母“W”:
- 第一個低點。市場上漲,這表明在下跌趨勢中出現了回調。
- 第二個最低點。市場拒絕了先前的波動最低點。這裡存在買家壓力,但現在還太早判斷市場是否能繼續上漲。
- 頸線。價格突破了阻力水平,表明買家控制市場,市場可能會繼續上漲。
正是由於圖表上的這種變化,這種模式被稱為W型圖表交易。
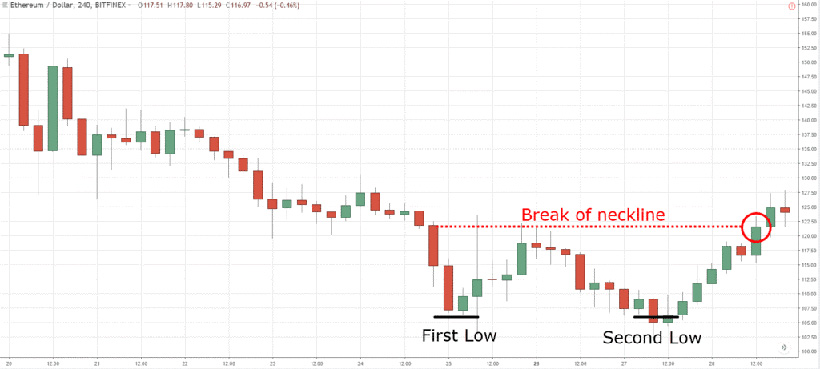
底線是價格下跌到新低,然後在返回到新低之前稍微反彈一下。 當賣家無法降低價格以繼續下跌趨勢時,他們會賣出,導致價格從該水平急劇反彈。 這種模式的看漲確認是由突破兩個低點之間的高點處的關鍵價格水平確定的,該水平作為阻力水平(頸線)。
雙底模式的相反是雙頂模式。 如果在圖表上看到這種情況,請將其視為一個看跌的逆轉信號。 這是一個同樣強大的技術工具。 起初,所有這些方案可能看起來太複雜。 使用最佳外匯機器人自動執行最複雜的過程,並在最小風險下逐漸學習。
外匯交易中的雙底
讓我們更深入地探討問題的具體內容,“外匯中的雙底是什麼?” 如何正確識別圖表上的這些模式,及時找到方法,以及來自專業交易者的建議,以使趨勢成為您的朋友並明智而正確地行動?
在外匯圖表上識別雙底
要使用外匯雙底模式進行交易,您需要學會無法失誤地在圖表上識別此模式。 在實踐中,這比在示例中更複雜,因為在您的屏幕上,您看到的是動態圖像,因此,您被迫盡快做出反應,一旦您識別出這個或那個圖案。 一份小指南將幫助您不要感到困惑。
- 在圖表上尋找兩個不同的底部,其寬度和高度相同。它們之間的距離將取決於您選擇的時間範圍,但請嘗試不要使其太短。
- 確保您已根據應連接圖案兩個低點的阻力水平正確識別了該圖案。
- 使用其他技術指標(如移動平均線或震盪器)確認該圖案。
除了專注於支撐和阻力水平外,您還可以使用“測量移動”技術來幫助您在交易外匯雙底圖案時確定潛在目標。
要找到測量移動目標,只需將兩個低點到頸線的距離延伸到市場高點。例如,如果雙底到頸線的距離為170點,則您必須再測量額外的170點以確定目標。
雙底外匯策略的優缺點
使用外匯雙底指標對交易者有許多優勢,包括:
- 該模型提供了明確的逆轉信號。交易者看到下跌趨勢可能結束,上升趨勢可能開始。這使您能夠在正確的時間開倉。
- 通過等待頸線建立後再進行交易,交易者可以減少風險並改善風險回報比。
- 可以使用虛假突破技術從錯誤進入市場的交易者中獲利。
- 通過使用多個時間框架,您可以提高逆轉交易的準確性並更好地了解整體市場趨勢。
雙底圖案外匯的風險和缺點也存在,您也應該注意它們。
- 可能形成雙底,但價格可能不會突破頸線,導致逆轉失敗。
- 等待雙底圖案確認後再進行交易可能導致進場較晚,因此潛在利潤較少。
- 此外,在圖表上確定圖案的過程有些主觀,因為不同的交易者可能會以不同方式畫線,導致對圖案的解釋各異。
外匯雙底交易提示
以下是如何交易雙底圖案外匯的最簡單提示。當價格跌破第一個低點時,看跌的交易者開設空頭倉位並將止損設置在低點之上。如果價格突然上漲,這些空頭交易者將被困在自己的倉位中。利用這種情況,開倉多單,期待如果價格繼續上漲,將觸發他們的止損並將市場朝您有利的方向移動。
這是一個關鍵提示。以下還有一些。
等待確認
確認發生在價格突破頸線時,表明可能發生看漲逆轉。建議等待伴隨著顯著增加交易量的突破,因為這證實買家控制局勢,價格可能繼續上漲。
管理風險
使用止損來限制潛在損失,永遠不要冒超過您能承受的損失。交易者通常遵循一條經驗法則:在單筆交易中不要冒超過您交易資本的2%風險。
使用多個時間框架
這將提供更廣泛的趨勢視角,有助於確定潛在的支撐和阻力水平。例如,交易者可以使用較高的時間框架來確定一般趨勢,並使用較低的時間框架來確定進出點。
將雙底交易與其他指標結合
雙底形態信號潛在的看漲反轉,但與其他指標結合以進行確認可能是有用的。例如,您可以使用振盪指標,如相對強度指數(RSI)或移動平均匯聚分歧(MACD)來確認趨勢反轉並識別超賣市場條件。
結論
閱讀本短篇課程後,您應該記住的主要規則:
- 學會在圖表上定義一個圖形。在確定這是雙底形態之前,不要著急採取行動。為此,您可以選擇其他指標進行確認或等待突破。這將為您提供更好的風險回報比。但不要等太久,以免錯過獲取最高可能利潤的機會。
- 當價格低於20MA時,在強勢下跌期間不值得在雙底形態中購買。為了避免不必要的風險,您還必須設置止損,並且不要以您無法承擔的金額開立交易。
此外,請記住虛假突破策略,以從受困的交易者中獲利。所有這些將幫助您從每筆交易中獲得更多利潤並承擔更少風險。因此,您的外匯交易將取得成功。