許多交易員夢想擁有一份外匯蠟燭圖案速查表,幫助他們找到對應貨幣價格波動的正確解決方案。要精通趨勢預測的藝術,首先要學習本文將介紹的最受歡迎的蠟燭圖案。
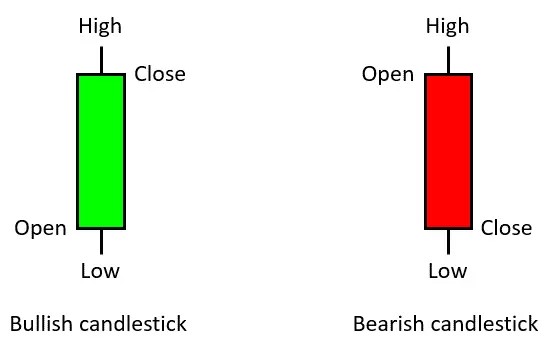
外匯交易中的蠟燭圖是什麼?
對技術分析的深入了解使交易員即使不深入基本分析也能完美地適應外匯市場。因此,熟悉交易員可以依賴的指標對於成功開啟和關閉訂單是必要的。通過外匯蠟燭圖案的幫助,您可以輕鬆預測貨幣價格的進一步變動。
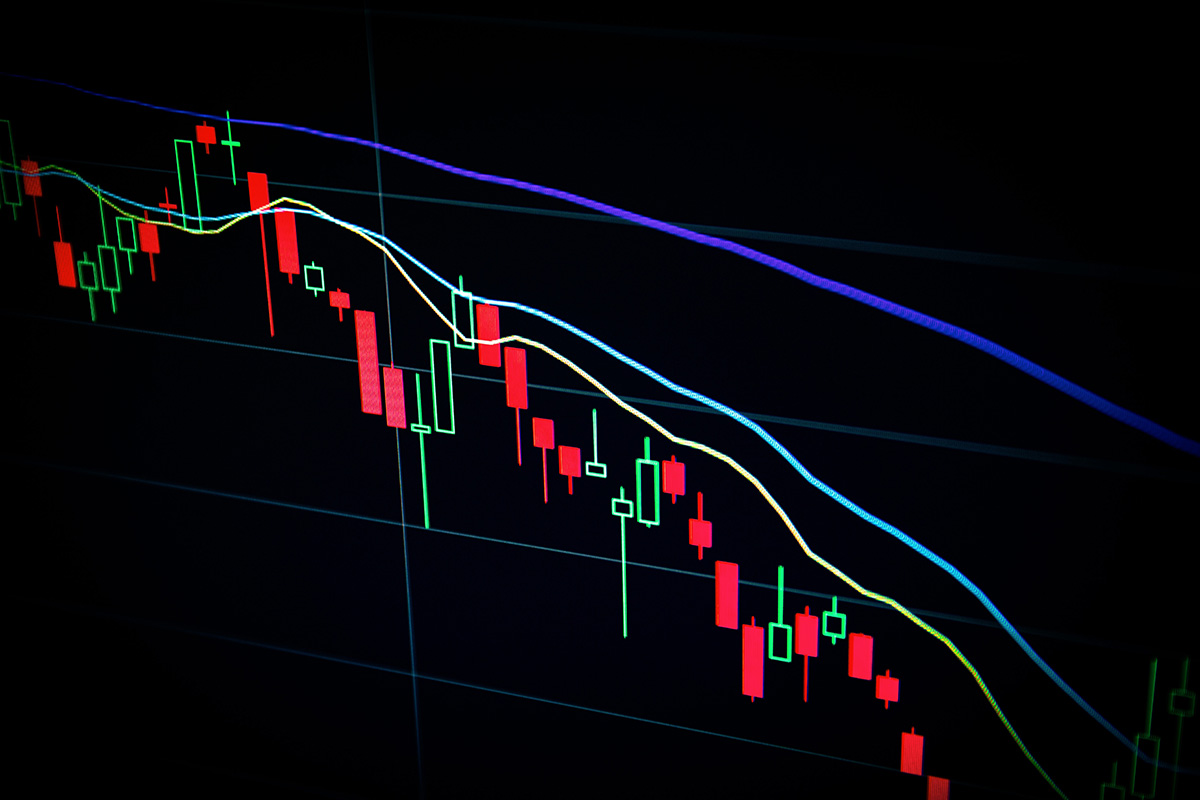
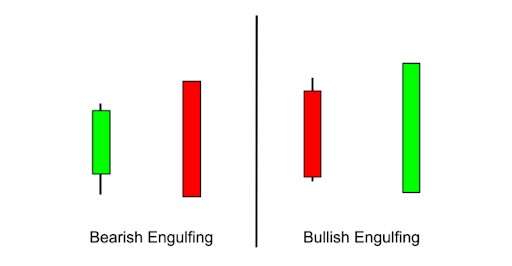
外匯市場的市場趨勢可能會強烈而明確地變化,或者可能存在一段不確定期。在這一點上,風險更高,但可能的利潤更為可觀。當買方主導地位被賣方主導地位或反之取代時,趨勢反轉就會發生。對於這些情況,使用吞沒蠟燭類別:
- 看漲吞沒圖案表明趨勢急劇轉變為價格上漲,市場開始擴大。
- 看跌吞沒圖案表明市場變窄並趨勢反轉,使價格下降。
学习如何阅读外汇蜡烛图,以查看所有的趋势并提前预测。如果您不想深入了解技术分析的所有细节,请使用最佳外汇机器人。它们完全了解所有交易算法,并将成为您不可或缺的助手。
如何阅读外汇交易中的蜡烛图?
蜡烛图是技术分析的通用工具,因为它们可以用来发现许多有用的信息:
- 市场中买家或卖家的主导地位;
- 趋势逆转的概率;
- 及时止损或获利的最佳点;
- 波动性和价格分散等等。
了解最流行的外汇蜡烛图,以有效地将它们用于您的交易策略。有了这些信息,您将知道如何阅读外汇交易中的蜡烛图。
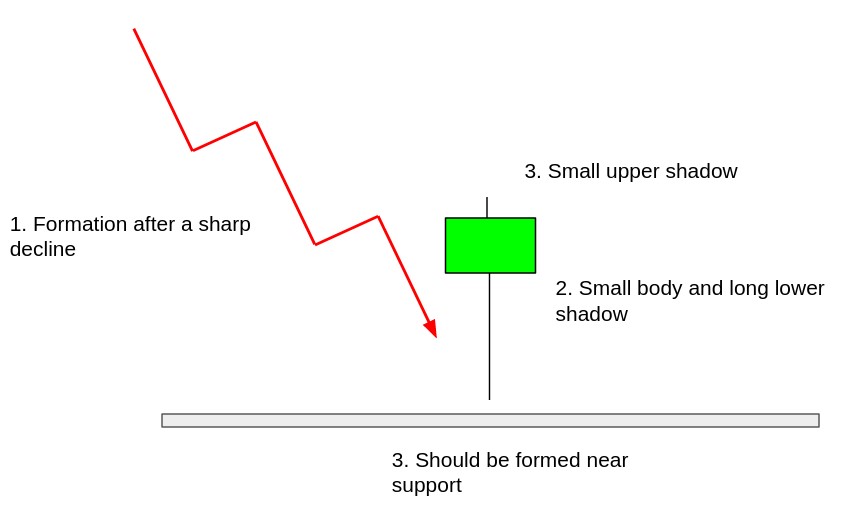
锤子蜡烛图案
在锤子蜡烛图案外汇中,可以看到价格向看涨趋势的主导地位逆转。在这种情况下,它将是一个绿色蜡烛,底部是一个短实体,位于下降趋势的底部。但同时,它将有一个很长的下影线,这表明卖家和买家之间的竞争加剧。
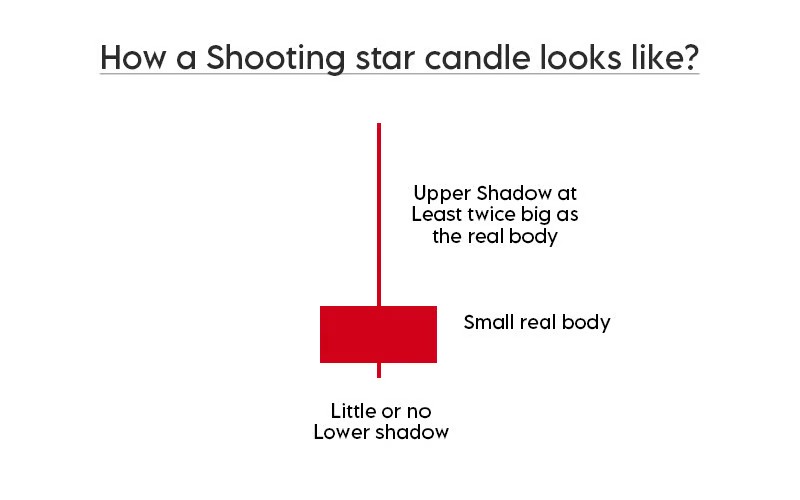
射击之星
在外匯蠟燭圖案速查表中,這個圖案也表明了一個有利於熊市的趨勢反轉。這樣一根紅色蠟燭在上升趨勢的頂部形成,具有短小的紅色實體和非常高的上影線。它顯示市場開盤後曾試圖延續上升趨勢,但最終以失敗告終。這意味著下跌趨勢將在市場中佔主導地位一段時間。
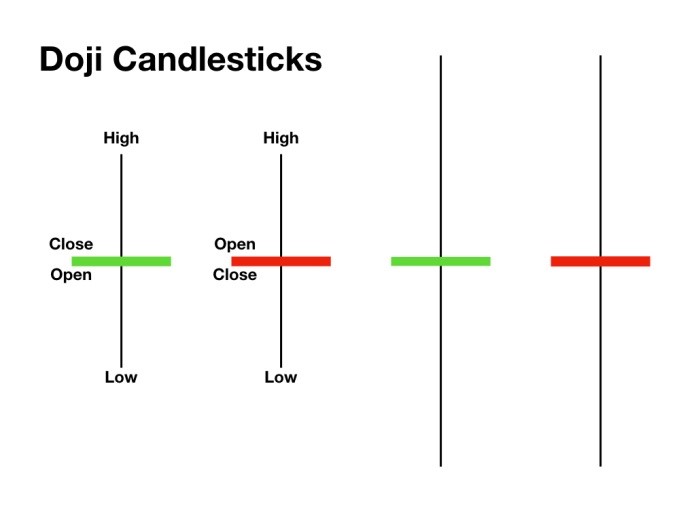
十字星
外匯蠟燭可能幾乎沒有實體,但看起來像兩條交叉的線。垂直線表示影線的長度,而水平線表示開盤價和收盤價幾乎相同。十字星圖案有幾種變化,需要與其他指標一起解釋。
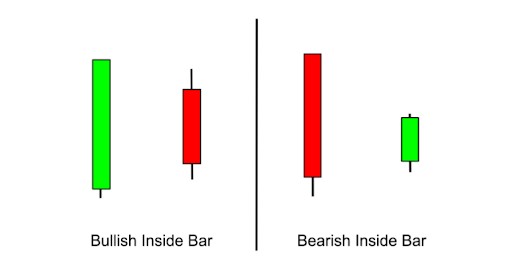
內部棒
當您看到兩根不同顏色的蠟燭中,一根稍高或稍低時,這表明一種新興趨勢。但有時在外匯蠟燭圖中,相反顏色的棒在前一根的價格範圍內。這表明在資產價格急劇上漲或下跌後,它正在穩定下來。
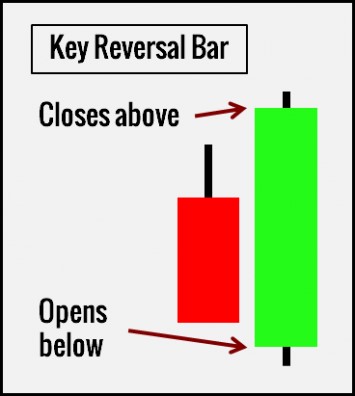
關鍵反轉
与内部条不同,关键逆转外汇蜡烛图案显示资产价格范围开始扩大。在这一天交易以比前一天更低或更高的价格开盘,并根据看涨或看跌趋势以更高或更低的价格收盘。这表明可能会进一步改变趋势,但在某些情况下,也可能是短期价格修正。
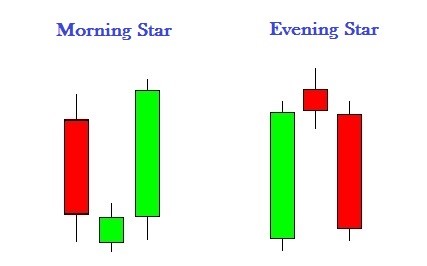
晨星和暮星
外汇蜡烛图可以提供明确的信号,也可以带来希望,即趋势逆转的第一个迹象。这些图案包括晨星和暮星,由三根蜡烛组成。中间的蜡烛有一个非常短的实体,颜色可以是任何颜色,与前一个或下一个相同。第三根蜡烛的实体颜色将指示趋势转向的方向。
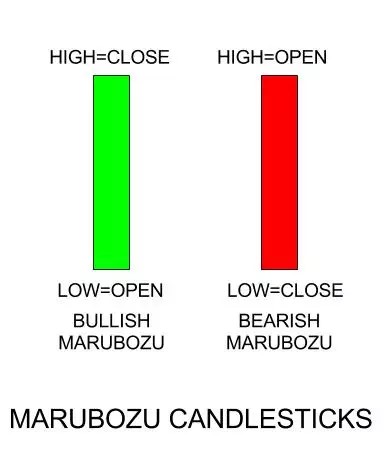
光头光脚蜡烛
了解外汇蜡烛包括识别市场中是否存在稳定的趋势以及对立之间的斗争。光头光脚蜡烛没有影线,或者至少没有顶部或底部的影线。这意味着买家或卖家完全控制了交易会话。
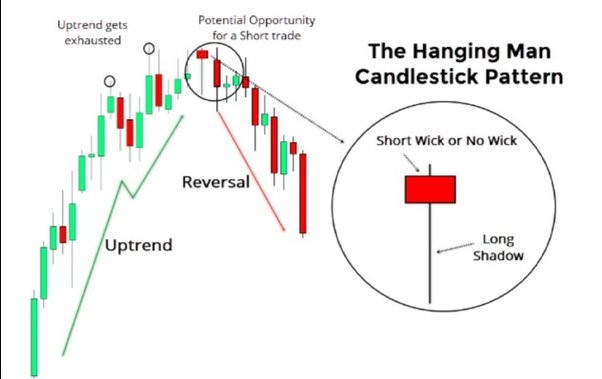
吊人
這種模式屬於外匯中那些表明前一趨勢耗盡的蠟燭類型。在這種情況下,它表明資產價格的上漲已經完成,將會隨之而來的是下跌。該條形狀結束了上升趨勢,底部有一根非常長的蠟燭影線,頂部有一根短的蠟燭影線,並且有一個小的實體。
穿透線
要理解這種外匯蠟燭的含義,請注意看看看看看看看看看看看看看看看看看看看看看看看看看看看看看看看看看看看看看看看看看看看看看看看看看看看看看看看看看看看看看看看看看看看看看看看看看看看看看看看看看看看看看看看看看看看看看看看看看看看看
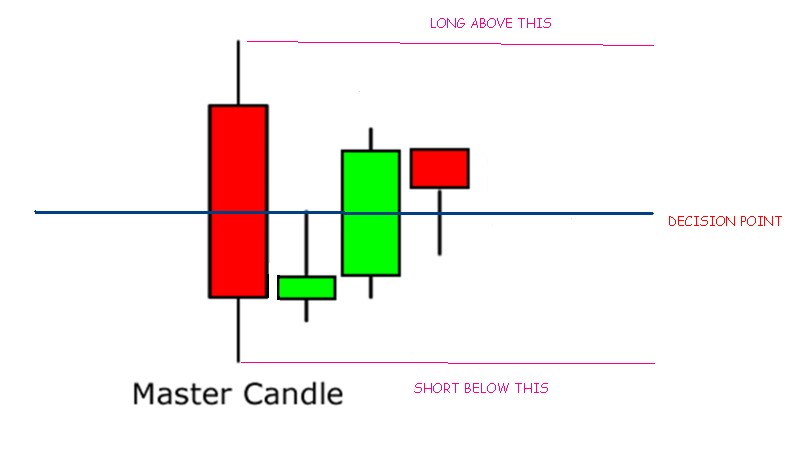
主蜡烛
市场分析师还使用外汇蜡烛图,这些图并不总是在变化。其中一个例子就是主蜡烛。在这种情况下,一个大的蜡烛图后面跟着4个连续的蜡烛图,它们可以是不同的颜色,但不会超过它。这种情况表明价格发生了急剧变化,然后试图稳定下来。
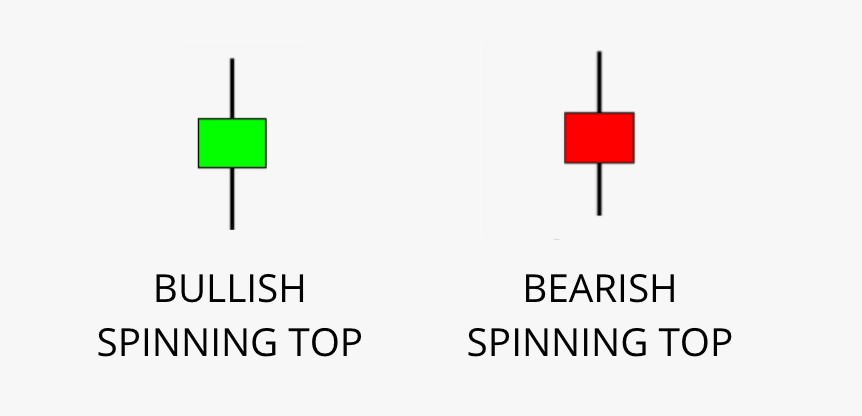
纺锤顶
当买家和卖家力量达到大致平衡时,纺锤顶蜡烛会出现在其他外汇蜡烛图案中。它有一个短的身体,中间是蜡烛芯。这表明尽管资产价格在一天中波动,但在收盘时与开始时大致相同。
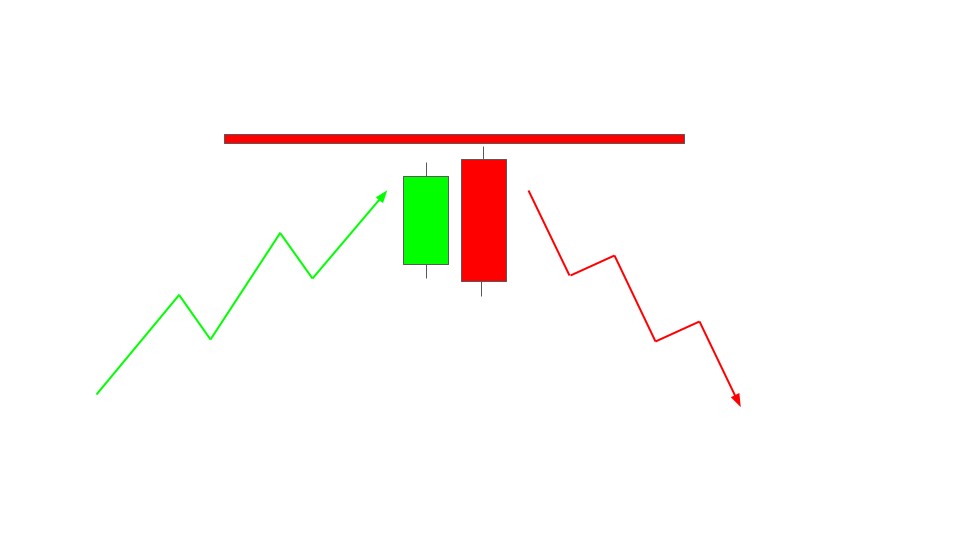
看跌吞没蜡烛
这种图案表明看涨趋势正在减弱,而看跌趋势正在增强。这可以从绿色蜡烛后面出现的红色蜡烛完全覆盖它来看出。
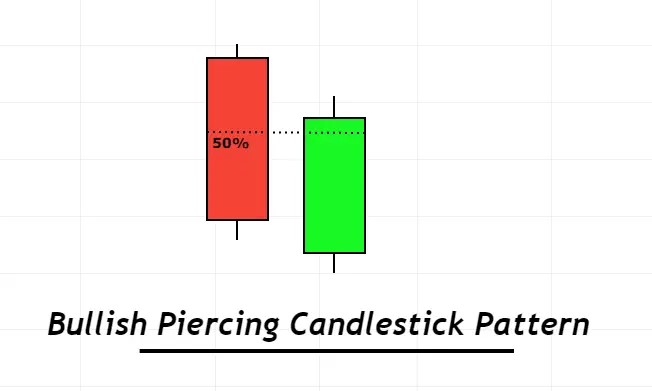
刺透图案
这两个外汇蜡烛图案表明下降趋势已经耗尽。交易从前一天的收盘价下方开始,但在一天结束时突破并收于中线以上。
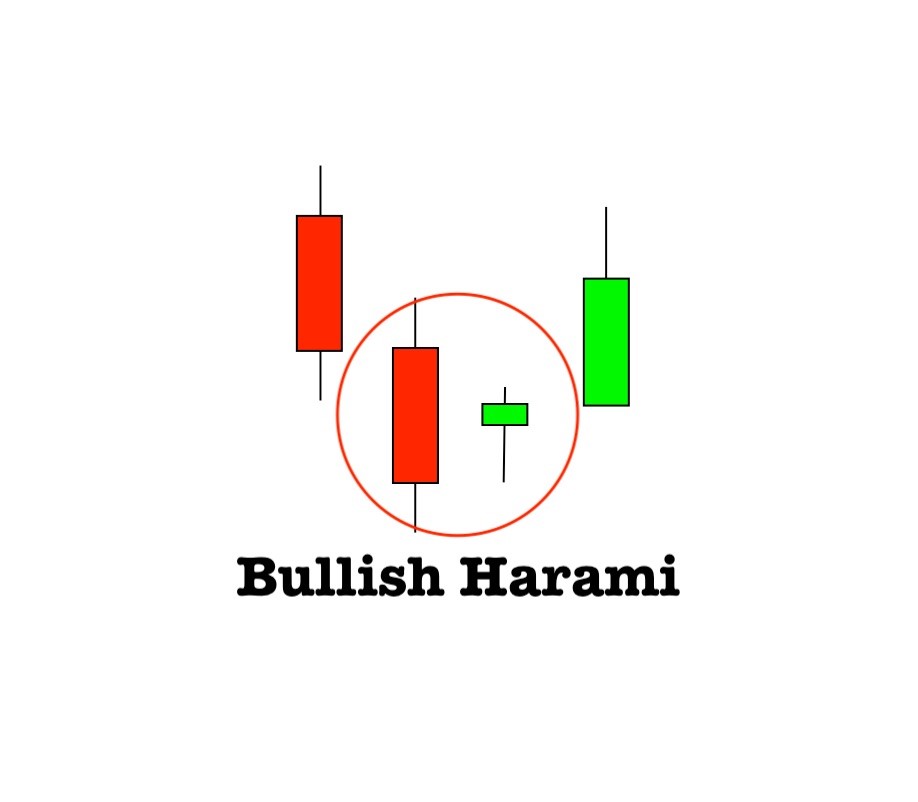
锤头线形态
如果在一对蜡烛图中,一个是大的,下一个是小的并且颜色相反,这样的形态被称为锤头线形态。在翻译中,这意味着“怀孕的女人”,并且表明输掉的趋势逐渐开始获得动力。
外汇交易中哪种蜡烛线最好?
对于交易者来说,所有外汇蜡烛线形态都是有价值的,因为它们暗示着进一步的价格走势。分析师使用超过60种不同的形态来确定最佳的市场进出点。然而,本文中介绍的16种是最常见和有效的。学会在总体价格走势中看到它们后,您将能够独立决定开仓和平仓的时机。
最后一点
现在您已经弄清了外汇交易中的蜡烛线是什么,开始尝试不同的策略吧。它们将是您最好的助手,使技术分析不仅简单而且非常令人兴奋。与此同时,在您研究基于这些指标的交易特点时,可以利用外汇机器人的服务。通过结合不同的方法,您将找到适合个人交易风格的完美平衡。