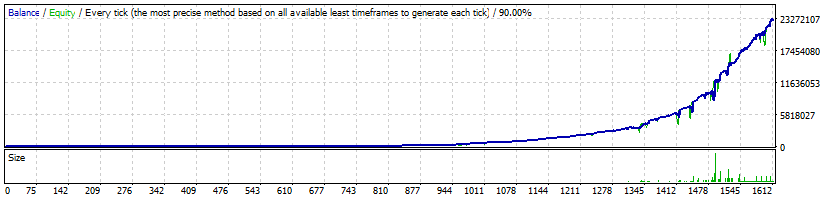
Strategy Tester Report
FXHexaFlow
EGlobal-Demo (Build 1441)
| Symbol | GBPUSD (Great Britain Pound vs US Dollar) | ||||
| Period | 1 Hour (H1) 2017.01.02 00:04 - 2026.01.21 14:36 (2017.01.01 - 2026.02.01) | ||||
| Model | Every tick (the most precise method based on all available least timeframes) | ||||
| Bars in test | 3293229 | Ticks modelled | 34226056 | Modelling quality | 90.00% |
| Mismatched charts errors | 0 | ||||
| Initial deposit | 1000.00 | Spread | 30 | ||
| Total net profit | 23038086.71 | Gross profit | 41504794.99 | Gross loss | -18466708.29 |
| Profit factor | 2.25 | Expected payoff | 14309.37 | ||
| Absolute drawdown | 673.23 | Maximal drawdown | 5936971.84 (58.40%) | Relative drawdown | 94.79% (219845.13) |
| Total trades | 1610 | Short positions (won %) | 686 (77.55%) | Long positions (won %) | 924 (75.54%) |
| Profit trades (% of total) | 1230 (76.40%) | Loss trades (% of total) | 380 (23.60%) | ||
| Largest | profit trade | 3056296.32 | loss trade | -792305.19 | |
| Average | profit trade | 33743.74 | loss trade | -48596.60 | |
| Maximum | consecutive wins (profit in money) | 44 (53977.41) | consecutive losses (loss in money) | 5 (-58878.66) | |
| Maximal | consecutive profit (count of wins) | 3709583.67 (5) | consecutive loss (count of losses) | -1682990.94 (3) | |
| Average | consecutive wins | 5 | consecutive losses | 2 | |