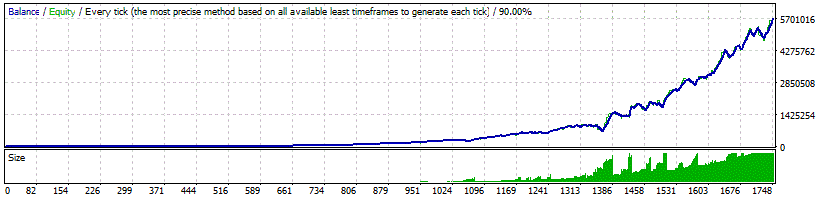
Strategy Tester Report
Forex Trend Detector_v4.0
Alpari-ECN-Demo (Build 1090)
| Symbol | EURUSD (Euro vs US Dollar) | ||||
| Period | 5 Minute (M5) 2010.09.21 00:00 - 2018.01.24 23:59 (2010.09.21 - 2018.01.25) | ||||
| Model | Every tick (the most precise method based on all available least timeframes) | ||||
| Bars in test | 2728070 | Ticks modelled | 5444876 | Modelling quality | 90.00% |
| Mismatched charts errors | 0 | ||||
| Initial deposit | 2000.00 | Spread | 10 | ||
| Total net profit | 5707295.47 | Gross profit | 9941428.10 | Gross loss | -4234132.63 |
| Profit factor | 2.35 | Expected payoff | 3268.78 | ||
| Absolute drawdown | 32.61 | Maximal drawdown | 799900.00 (14.58%) | Relative drawdown | 37.19% (396784.79) |
| Total trades | 1746 | Short positions (won %) | 907 (66.81%) | Long positions (won %) | 839 (63.17%) |
| Profit trades (% of total) | 1136 (65.06%) | Loss trades (% of total) | 610 (34.94%) | ||
| Largest | profit trade | 96850.00 | loss trade | -37655.00 | |
| Average | profit trade | 8751.26 | loss trade | -6941.20 | |
| Maximum | consecutive wins (profit in money) | 45 (52064.44) | consecutive losses (loss in money) | 16 (-175829.15) | |
| Maximal | consecutive profit (count of wins) | 1040541.97 (27) | consecutive loss (count of losses) | -474376.00 (14) | |
| Average | consecutive wins | 8 | consecutive losses | 4 | |